Get Indexology® Blog updates via email.

In This List

Tesla: Not an Automatic Addition to the S&P 500 ESG Index

So Different Yet So Alike…

Core Considerations: Why Liquidity Matters

Learning from Sector Changes in the S&P Composite 1500

What Drives the S&P PACT Indices’ Weights?

Tesla: Not an Automatic Addition to the S&P 500 ESG Index

Contributor Image
Daniel Perrone

Former Director and Head of Operations, ESG Indices

S&P Dow Jones Indices

Since S&P Dow Jones Indices announced that Tesla would be added to the S&P 500® on Dec. 21, 2020, many investors have contacted us asking when this transformative company will become a member of the S&P 500 ESG Index, the sustainable counterpart to the S&P 500. The answer, in brief, is that Tesla will not automatically join the S&P 500 ESG Index upon its addition to the S&P 500. Instead, Tesla will be assessed during the next annual rebalance of the S&P 500 ESG Index, taking place at the end of April 2021. But even then, inclusion into the index is not assured. Whether Tesla becomes an index constituent will be determined by its sustainability performance across many criteria relative to its peers.

Tesla’s ESG Score

The main driver of whether a company is selected to join the S&P 500 ESG Index is its S&P DJI ESG Score. This score is derived from the annual Corporate Sustainability Assessment (CSA), which is administered by SAM, a part of S&P Global. The CSA is a highly granular, industry-specific questionnaire based on financial material ESG metrics. Insights gathered from the CSA form the backbone of the ESG score that is used to select companies added to the S&P 500 ESG Index.

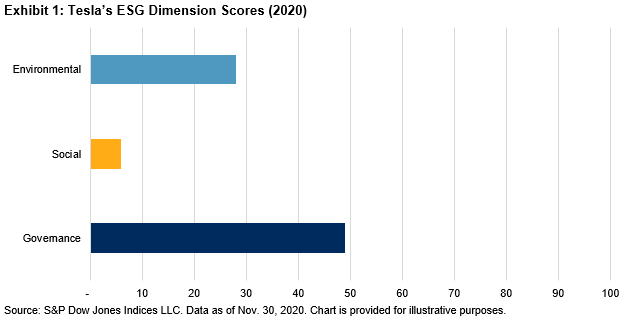
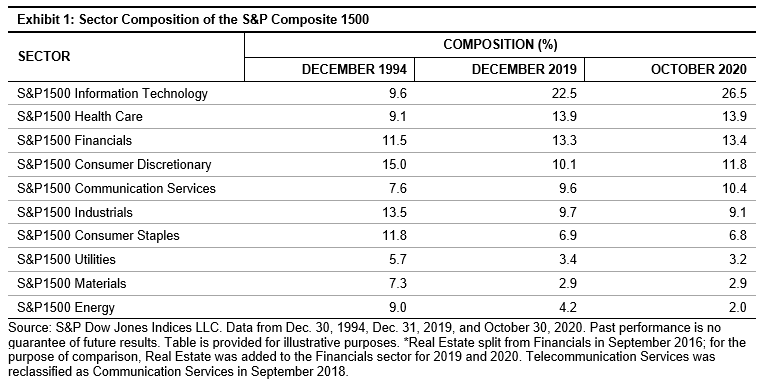
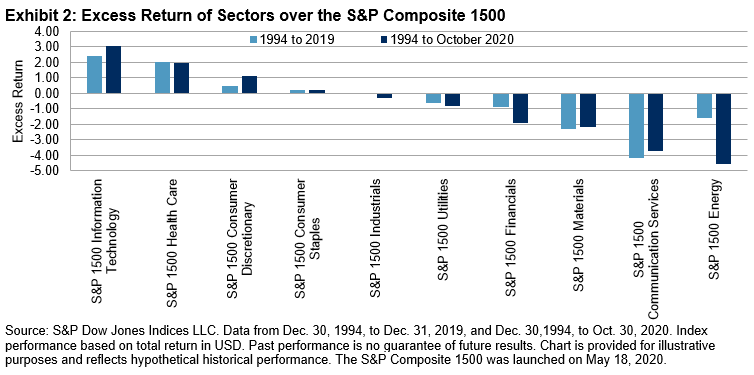
For this current assessment year, Tesla’s S&P DJI ESG Score was 22 out of 100, up 8 points from 2019’s score. This is driven by its ESG Dimension Scores, including an Environmental score of 28 (up 1 point from last year), a Social score of 6 (up 2 points), and a Governance score of 49 (up 21 points). Tesla does not fill out the CSA, so its S&P DJI ESG Score is determined based on research using publicly available information.

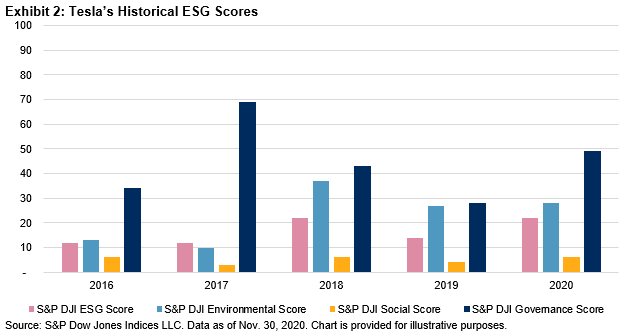
Many may be surprised to see such a low overall ESG score (and Environmental score) for Tesla, given its focus on electric vehicles. Specializing in “green” products, however, does not automatically ensure that companies will score well from an overall ESG perspective. The S&P DJI ESG Score is wide ranging in what it encompasses, as it is meant to capture a company’s broad sustainability performance.

In the Environmental dimension, Tesla of course scored well in the area of low carbon strategy, with a nearly perfect score of 99. However, the company scored low in environmental reporting, climate strategy, and environmental policy and management systems, which suppressed the company’s overall Environmental score.1 Tesla also scored especially low on social metrics across the board, which include human capital development, social reporting, and labor practice indicators. Tesla did comparatively well in the Governance realm, especially relative to the prior year.2

The S&P 500 ESG Index Methodology

So, what does this mean for Tesla’s standing in the S&P 500 ESG Index? We won’t know until the upcoming annual rebalance is finalized on the last business day of April 2021. At that time, Tesla will be measured against its peers across many ESG criteria. As mentioned earlier, however, the biggest determinant of the composition of the S&P 500 ESG Index is a company’s S&P DJI ESG Score. But it’s not just a company’s absolute performance that matters; a company also needs to rate well relative to its peers.

The S&P DJI ESG Score is used in two ways in the index methodology. First, the bottom 25% of companies in each GICS® industry group is screened out on a global basis. This prevents a company that is a good ESG performer locally but poor on a global basis from making it into the index. Second, companies are ranked by their ESG score within the S&P 500 and then selected from the top down to get as close as possible to 75% of the industry group’s original market capitalization.

Will Tesla make it through these two key screens and become a member of the S&P 500 ESG Index? Next April, we’ll know. The S&P 500 ESG Index has no early-entry rule that would afford Tesla extra privileges; it will be treated the same as any other company.


The author would like to thank Reid Steadman for his extensive contributions to this blog post.


1 According to the CSA, low carbon strategy (which is a unique criterion to the automobiles industry) is defined as an assessment of strategies implemented by companies to reduce the carbon intensity of their core portfolio, while climate strategy is defined as an assessment of strategies put in place by companies to address the scale of the challenge climate change represents for their industry, and environmental policy and management systems covers management tools implemented by companies in order to improve their environmental performance in a cost-effective way and reduce the risk of incurring fines or penalties for not complying with environmental legislation.

2 To provide some context for Tesla’s scores, the S&P DJI ESG Scores are normalized across global industries and are designed to be read as percentiles. Thus, a score of 22 means that that company had a higher score than 22% of its industry peers globally.

The posts on this blog are opinions, not advice. Please read our Disclaimers.

So Different Yet So Alike…

Contributor Image
Fei Mei Chan

Former Director, Core Product Management

S&P Dow Jones Indices

To say that the world is different now than it was a year ago would be an astounding understatement. COVID-19 brought about once unimaginable conditions and changes. In the financial realm, market volatility spiked and remains markedly higher across all sectors compared to the beginning of 2020. Yet, observing the market based purely on performance, it would almost seem as if all was normal. The S&P/TSX Composite Index, after March’s blip, is up 6.8% through Dec. 17 and continuing its uptrend heading into the new year.

The changes in latest rebalance of the S&P/TSX Composite Low Volatility Index, effective after the close of trading on Dec. 18, 2020, were predictably small based on the changes in sector volatility in the last three months shown in Exhibit 1. The index shifted 2% of its weight away from Health Care and Information Technology, while shifting the most weight into Utilities and Industrials. There were only three name changes.

The posts on this blog are opinions, not advice. Please read our Disclaimers.

Core Considerations: Why Liquidity Matters

Learn how the liquidity and interconnectivity of the S&P 500 ecosystem benefits market participants. CME Group’s Tim McCourt and State Street Global Advisors’ Rob Forsyth join S&P DJI’s Craig Lazzara to discuss.


Learn more: https://www.spglobal.com/spdji/en/research/article/a-window-on-index-liquidity-volumes-linked-to-sp-dji-indices/

The posts on this blog are opinions, not advice. Please read our Disclaimers.

Learning from Sector Changes in the S&P Composite 1500

Contributor Image
Rachel Du

Senior Analyst, Global Research & Design

S&P Dow Jones Indices

The S&P Composite 1500® serves as a benchmark for around 90% of the U.S. equity market and offers a comprehensive perspective on it.1 Companies in the S&P Composite 1500 are classified into sectors based on the Global Industry Classification Standard (GICS®). As with the benchmark, the S&P Composite 1500 Sector Indices are weighted by float-adjusted market cap, and each contains stocks from its respective GICS sector. Hence, the sector changes in the S&P Composite 1500 over the years can tell us of the trends of the U.S. market.

Exhibit 1 shows the sector weights as of Dec. 31,1994, Dec. 31, 2019, and Oct. 30, 2020. Information Technology has become the dominant sector, followed by Health Care as the second-largest sector, while Materials and Energy sectors weighed the least in the index.

The weights of the Information Technology and Health Care sectors had the most significant growth from Dec. 30, 1994, to Dec. 31, 2019, with increases of 134% and 53%, respectively.

The same trend has continued through 2020. The weight of the Information Technology sector grew from 22.5% to 26.5% in less than a year (from the end of 2019 to Oct. 30, 2020). In fact, the weight of the sector in the S&P Composite 1500 has increased 176% since the end of 1994, from 9.6% to 26.5%.

In contrast, the sectors with the largest declines were Materials and Energy. Their weights dropped 60% and 53%, respectively, from Dec. 31,1994, to Dec. 31, 2019. The decrease in market share of both sectors has continued in 2020.

The performance of the sector indices reflects the sector changes over the history. Exhibit 2 shows the excess return of the sector indices versus the S&P Composite 1500 from Dec. 30, 1994, to Dec. 31, 2019, and to Oct. 30, 2020. Information Technology and Health Care were the top-performing sectors for both periods. Over the past 25 years, we observe continued outperformance in both sectors. This suggests that performance is one of the driving forces behind the sector expansion.

The leading constituents changed along with the sector changes. In 1994, the leading constituents were from diverse sectors, but a more concentrated composition is observed in 2019 and in 2020. As indicated in Exhibit 3, six out of ten stocks were from Information Technology and Communication Services sectors at the end of 2019 and October 2020. The three Information Technology companies together contributed 9.4% and 12.2% weight to the S&P Composite 1500 as of Dec. 31, 2019, and Oct. 30, 2020, respectively.

In society today, Information Technology is playing a larger role than ever. The advancement of technology has impacted people’s daily life, reshaped the economy, and is reflected in the stock market. Exploring the sector changes in the S&P Composite 1500, which is a gauge of U.S. market, can help us understand the transformed economic reality and could identify potential investment opportunities.


1 The S&P Composite 1500: An Efficient Measure of the U.S. Equity Market, Philip Brzenk, Hamish Preston, Aye Soe. May 2020.

The posts on this blog are opinions, not advice. Please read our Disclaimers.

What Drives the S&P PACT Indices’ Weights?

Contributor Image
Ben Leale-Green

Former Associate Director, Research & Design, ESG Indices

S&P Dow Jones Indices

In April 2020, we launched the S&P PACTTM Indices (S&P Paris-Aligned & Climate Transition Indices). The indices aim to align with the following: a 1.5oC climate scenario, the relevant aspects of the EU Low Carbon Benchmark regulation (BMR), and recommendations from the Task Force on Climate-related Financial Disclosures (TCFD), while maintaining a broad, diversified exposure. The S&P PACT Indices consist of the S&P Paris-Aligned (PA) Climate Indices and S&P Climate Transition (CT) Indices.

In this blog, we try to answer a simple question: what drives the S&P PACT Indices’ weights?

First, companies are excluded (exclusion effect) due to business activities, public controversies,1 and a low alignment score with the principals of the UN Global Compact—these companies receive zero weight.

Second, companies that remain are reweighted (reweighting effect) to achieve climate-related objectives.2 Companies that perform well from a climate perspective receive an overweight, while those that perform poorly receive an underweight or zero weight, as shown in Exhibit 1.

The S&P CT Indices (i.e., the indices that align with the EU’s minimum standards for EU Climate Transition Benchmarks) have fewer exclusions than their PA counterparts (i.e., the indices that align with the EU’s minimum standards for EU Paris-Aligned Benchmarks), with fossil fuel-based exclusions being the difference. Oil operations are particularly impactful in excluding companies. The additional exclusions are evident in the excluded columns in Exhibit 2, where the S&P PA Indices show more of their market cap is excluded.

When reweighting eligible companies to meet the climate objectives, we observe (see Exhibit 3) company performance on four climate metrics to have the largest and most significant impact on the change of company weights, across regions:

  • S&P DJI Environmental Score;
  • 1.5oC alignment via the transition pathway dataset;
  • Physical risk score; and
  • High climate impact revenues.

So how can companies improve the climate metrics that have the largest influence on their S&P PACT Indices weight? Ineligible companies can reduce undesirable exposures (e.g., public controversies and UNGC misalignment [as measured by the Arabesque GC Score]). Eligible companies can gain increased weight in the S&P PACT Indices by significantly reducing carbon intensity year-on-year (to improve their 1.5oC alignment), disclosing more information regarding environmental policies and metrics (to improve their S&P DJI Environmental Score3), improving performance against environmental policies and metrics (to improve their S&P DJI Environmental Score), divesting assets in locations highly exposed to physical risks and reduce assets’ physical risk sensitivity factors (to improve their physical risk score).

For further detail, please see our paper on S&P PACT Indices weight attribution.


1 Public controversies are judged by the SAM, part of S&P Global, Media Stakeholder Analysis (MSA), which monitors ongoing controversies from companies.

2 Climate-related objectives include the 7% year-on-year decarbonization, carbon intensity reduction, 1.5oC alignment using the Trucost, part of S&P Global, transition pathway dataset, S&P DJI Environmental Score improvement, green-to-brown share control/improvement, physical risk mitigation, high climate impact revenue constraint, carbon disclosure overweight cap, Science-Based Target overweight, and fossil fuel reserve exposure control/reduction.

3 The environmental score is the environmental pillar from the S&P DJI ESG Scores.

The posts on this blog are opinions, not advice. Please read our Disclaimers.