Get Indexology® Blog updates via email.

In This List

The Unrewarded Risk of Supernormal Fund Returns

Dissecting Performance Characteristics of Growth Factors in Australian Small-Cap Equities

Active U.K. Income Funds Endure Challenging Times

Global Islamic Indices Continue to Outperform, Gaining up to 13% over Conventional Benchmarks YTD

How Target Outcome Indices Work

The Unrewarded Risk of Supernormal Fund Returns

Contributor Image
Andrew Cairns

Director, Global Research & Design

S&P Dow Jones Indices

The recently released SPIVA® Europe Mid-Year 2020 Scorecard had the unique opportunity to pit the performance of active funds against their passive benchmarks through an exceptionally rare event. The economic fallout from the coronavirus pandemic brought a period of extreme volatility, the likes of which have not been seen in Europe since the global financial crisis of 2008. In doing so, rather than highlight the opportunities available to active managers in such times, it exposed an alarming risk—a high dispersion in fund returns. In other words, there were far more occurrences of active funds significantly underperforming or outperforming their benchmark than usual.

H1 2020: A Tale of Two Quarters

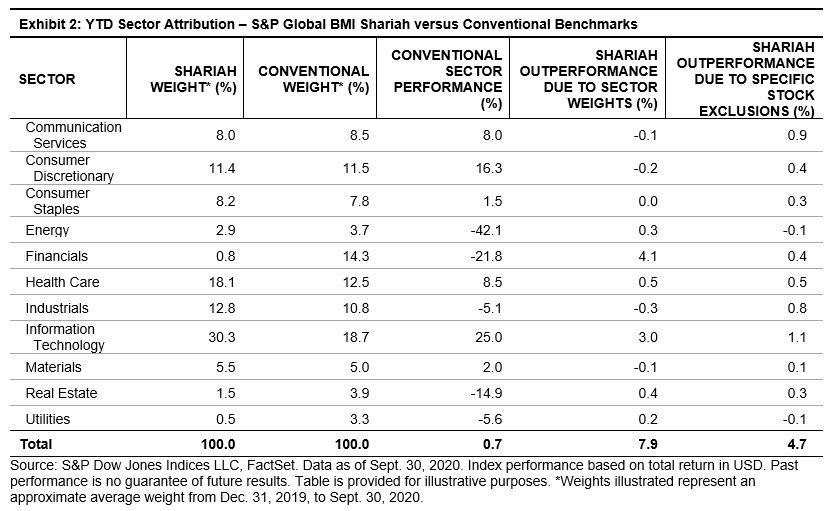
The first half of 2020 can be characterized as a market crash followed by a modest recovery.

During the first three months of 2020, as the coronavirus pandemic began to wreak havoc across European equity markets, European equity funds suffered significant drawdowns. At this point, the skill of active fund managers came into question as, despite their ability to actively defend their positions, they were largely unable to avoid substantial losses.

The following three months featured a recovery in the market, following hope that the virus was coming under control and local economies were reopening. On average, European equity funds pared back their losses and recovered at a faster rate than the benchmark. However, as Exhibit 1 highlights, there was high dispersion in fund returns, indicating that the risks to active fund investors, in fact, remained high.

Mixed Fortunes for European Equity Funds

Exhibit 2 illustrates the dispersion in returns through the five different periods featured in the SPIVA Europe Mid-Year 2020 Scorecard. In each case, we can see that European equity funds largely exhibited normally distributed returns. However, there was significant variation in the tails, particularly when comparing the more recent (YTD and 1-year) returns with the annualized medium- and long-term (5- and 10-year) returns. In the short term, positive supernormal returns were rare but still possible despite volatile market conditions. However, investors hoping to grow their investment should be wary that they were just as likely to select a fund on the opposite end of the spectrum that exhibited negative supernormal returns. Furthermore, the diminishing spread between the 75th and 25th percentiles and the shortening of the tails in each distribution over the 3-, 5-, and 10-year periods highlight that such returns have not typically persisted into the future.

In conclusion, the short-term risk that any individual investor in an active fund could experience returns substantially below the benchmark should be compensated with evidence that active funds typically outperformed over the long term. In the SPIVA Europe Mid-Year 2020 Scorecard, 87% of European equity funds underperformed the S&P Europe 350® over the 10-year period ending June 30, 2020. Therefore, without such evidence, the risk of supernormal fund returns is arguably unrewarded and, until the recent events, may have been largely unexposed.

The posts on this blog are opinions, not advice. Please read our Disclaimers.

Dissecting Performance Characteristics of Growth Factors in Australian Small-Cap Equities

Contributor Image
Arpit Gupta

Former Senior Analyst, Global Research & Design

S&P Dow Jones Indices

In our previous blog, we suggested growth factors with longer lookback periods may be more effective for constructing growth factor portfolios in Australian small-cap equities. In this blog, we examine the performance cyclicality, factor exposure, risk/return decomposition, and factor correlation for the long-term growth factor portfolios.1

From April 20, 2001, to June 30, 2020, the 12-month price momentum and 3-year sales growth factors showed statistically significant outperformance in up markets, with high outperformance probability (>60%), whereas they tended to underperform during down markets (see Exhibit 1). Together with the high market betas (>1.2), these performance characteristics confirmed the strong pro-cyclical nature of the 12-month price momentum and 3-year sales growth factors in Australian small-cap equities. Additionally, under neutral market conditions, the 12-month price momentum factor witnessed statistically significant outperformance, whereas the 3-year sales growth factor underperformed marginally.

On the contrary, weak performance cyclicality was observed for the 3-year earnings growth factor during the back-tested period. The factor showed modest outperformance in up markets and modest underperformance in down markets, with a return beta close to 1. Notably, the 3-year earnings growth factor showed statistically significant outperformance in neutral markets, with more than 70% outperformance probability.

In addition, the 3-year earnings growth factor showed a lower correlation (<0.20) with the 12-month price momentum and 3-year sales growth factors (see Exhibit 2). This differentiated performance across market cycles and low correlation with each other may serve as a basis to construct a composite growth factor portfolio combining the three examined factors.

All the three growth portfolios had high positive active exposure to their targeted factors. The 3-year sales growth and 3-year earnings growth portfolios had the highest exposure to the growth factor, whereas the 12-month price momentum portfolio had the highest active exposure to the mid-term momentum factor. The mid-term momentum factor contributed most to the excess return for the 3-year sales growth and 12-month momentum portfolios, while the profitability factor contributed the highest excess returns for the 3-year earnings growth portfolio (see Exhibit 3).

Unintended factor exposure was also observed among the growth portfolios; most notably, 12-month price momentum and 3-year sales growth portfolios had strong negative active exposure to the dividend yield factor, which was what dragged the performance of both these portfolios most significantly. These portfolios also had higher active exposure to volatility and market sensitivity (i.e., high return volatility and high beta, as observed in Exhibit 1). Higher volatility exposure had negatively affected the returns of the 12-month price momentum and 3-year sales growth portfolios.

In summary, the 12-month price momentum, 3-year sales growth, and 3-year earnings growth factors exhibited distinct performance cyclicality and unique factor exposure in the Australian small-cap equity market. The 12-month price momentum and 3-year sales growth factors showed pro-cyclical characteristics, whereas the 3-year earnings growth factor was much less cyclical. The unique industry factor exposure and style exposure help explain the performance differentials and excess return drivers of these portfolios over the long term.

1 12-month price momentum, 3-year earnings growth, and 3-year sales growth based on the S&P/ASX Small Ordinaries were studied for this analysis.

The posts on this blog are opinions, not advice. Please read our Disclaimers.

Active U.K. Income Funds Endure Challenging Times

Contributor Image
Ari Rajendra

Senior Director, Head of Thematic Indices

S&P Dow Jones Indices

The U.K. has been one of the worst-hit countries in developed markets in terms of dividend cuts in 2020. One in two dividend-paying companies in the S&P United Kingdom BMI have cut dividends, while half of the remaining companies are also expected to cut dividends.1 A tough year indeed for equity income managers, as opportunity to differentiate abates in the near term. This blog explores why this may be so and draws attention to the benefits of indexing under the current environment.

Selection Pool for Dividend Growth Strategies Has Shrunk Significantly

Prior to the pandemic, there were a little over 300 dividend-paying companies within the S&P United Kingdom BMI, but this has now fallen to just under 200. Despite the reduction, this may still appear to be a sizable selection universe for dividend funds. However, the impact could be amplified depending on the type of dividend strategy. For example, a consistent dividend growth strategy would select companies that have maintained stable or growing dividends for a certain number of consecutive years. Exhibit 1 illustrates that the number of such companies has fallen by more than 50% since 2018.2

Dividend Portfolios Could See Convergence in Holdings

At present, approximately GBP 60 billion3 of assets are currently in U.K. dividend-based strategies, mostly in active funds. Many of them may employ dividend growth strategies. The potential implication of a reduced selection pool is an increased likelihood of holdings overlap between these active dividend funds.

While an accurate comparison of holdings between active funds is challenged by inconsistent reporting dates and incomplete disclosures, there were some interesting observations.

Sustainable dividend payers such as GlaxoSmithKline, Phoenix Group, British American Tobacco, Legal & General Group, and RELX were among names found to be commonly present in many of the largest income funds,4 all of which are also present in the S&P UK High Yield Dividend Aristocrats® Index. Intriguingly, the top four active income funds, with combined assets of almost GBP 15 billion, were each also observed to have at least 35%, and an average of 46%, of their respective assets invested in stocks within the S&P UK High Yield Dividend Aristocrats Index,5 a figure that could rise even further.

A potential consequence of commonality of dividend portfolios is convergence in performance. Although inconclusive, the performance difference between the median active fund and its passive counterpart, the S&P UK High Yield Dividend Aristocrats Index, has converged to a tighter range in recent months, as shown in Exhibit 2. It is also worth highlighting that the index posted meaningful outperformance of 2.6% YTD as of Sept. 30, 2020.

Diminishing Value of Active Income Funds in Recent Years

Historically, active manager selection has indeed shown to add value. Exhibit 3 shows that at least 75% of active funds were able to outperform the S&P UK High Yield Dividend Aristocrats Index over the 5- and 10-year periods ending Sept. 30, 2020. However, the tide shifted in recent years, when only 14% of funds outperformed over the past year. Going forward, outperformance may prove to be a greater challenge for the aforementioned reasons.

It is also worth noting that this analysis used gross-of-fees returns and does not include the 1% average management fee imposed by active funds. Thus, on a net-of-fees basis, a large part of the long-term excess returns would have been eroded by fees (see annualized excess returns in Exhibit 3).

Grounds for Hope

Equity income investors choosing to stay the course have reason to take comfort from some of the drivers of dividend cuts. First, unlike the Global Financial Crisis, in 2020 companies acted prudently by pre-emptively cutting dividends to shore up balance sheets. Second, regulatory and political pressure forced many companies to suspend their dividends. Both are reasons to believe that many of these companies may be better positioned to resume dividend payments in the future. In fact, some already have.

A narrower selection pool and relatively higher fees may continue to limit the opportunity for active funds to differentiate, and we highlight their recent underperformance versus an alternative passive income benchmark. As such, the S&P UK High Yield Dividend Aristocrats Index can be a compelling passive solution for capturing U.K. dividends.

1    Based on indicative dividends for fiscal year 2020.
2    Fiscal year 2018, mostly paid in calendar year 2019.
3    Based on a screen of open-ended income funds in Morningstar.
4    Based on holdings data reported by Morningstar.
5    Two funds had last reported holdings on June 30, 2020, and one other only had 50% of holdings (by weight) disclosed.

The posts on this blog are opinions, not advice. Please read our Disclaimers.

Global Islamic Indices Continue to Outperform, Gaining up to 13% over Conventional Benchmarks YTD

Contributor Image
John Welling

Director, Global Equity Indices

S&P Dow Jones Indices

Global equities withstood a slump in the last month of the quarter, ultimately gaining 8.1% in Q3 2020 and entering positive territory YTD, as measured by the S&P Global BMI. Meanwhile, Shariah-compliant benchmarks,  including the S&P Global BMI Shariah and Dow Jones Islamic Market (DJIM) World Index, significantly outperformed conventional indices, ultimately gaining an advantage of 13.3% and 14.4% YTD, respectively. The outperformance trend played out across all major regions, with the DJIM World Emerging Markets Index leading the pack, providing an additional 21.3% return above the conventional benchmark.

Sector Performance as a Key Driver

As global equities continued to recover in Q3 2020, sector drivers played an important role in Shariah outperformance as Information Technology—which tends to be overweight in Islamic indices—was the best performer among sectors, while Financials—which is nearly absent in Islamic indices—continued to heavily underperform the broader market. Exhibit 2 demonstrates the effect on returns of over- and underweight sector allocations of the S&P Global BMI Shariah compared to the conventional benchmark.

The majority of the outperformance—7.9% of the 12.6% total outperformance YTD—is explained by differing sector allocations, while 4.7% is explained by stock selection differences within sectors.

MENA Equity in Recovery

Having fallen significantly during Q1 2020, MENA equity performance improved considerably, as the S&P Pan Arab Composite was down 4.8% YTD, a welcome contrast since logging Q1 losses of 23.4%. The S&P Bahrain led the way in the region in Q3, gaining 17.8%, followed by the S&P Saudi Arabia, which gained 13.6%. All MENA country indices remained negative YTD, while the S&P Saudi Arabia was the closest to recovery, down just 0.01% YTD.

For more information on how Shariah-compliant benchmarks performed in Q3 2020, read our latest Shariah Scorecard.

A version of this article was first published in Islamic Finance News IFN Volume 17 Issue 41 dated the 14th October 2020.


The posts on this blog are opinions, not advice. Please read our Disclaimers.

How Target Outcome Indices Work

Indexing is democratizing access to defined outcomes, providing a simple, transparent, index-based blueprint for target outcome strategies that can be applied to both active and passive vehicles. Take a closer look at what makes these indices tick and the range of potential applications for these innovative tools.

The posts on this blog are opinions, not advice. Please read our Disclaimers.