In our previous blog, we suggested growth factors with longer lookback periods may be more effective for constructing growth factor portfolios in Australian small-cap equities. In this blog, we examine the performance cyclicality, factor exposure, risk/return decomposition, and factor correlation for the long-term growth factor portfolios.1
From April 20, 2001, to June 30, 2020, the 12-month price momentum and 3-year sales growth factors showed statistically significant outperformance in up markets, with high outperformance probability (>60%), whereas they tended to underperform during down markets (see Exhibit 1). Together with the high market betas (>1.2), these performance characteristics confirmed the strong pro-cyclical nature of the 12-month price momentum and 3-year sales growth factors in Australian small-cap equities. Additionally, under neutral market conditions, the 12-month price momentum factor witnessed statistically significant outperformance, whereas the 3-year sales growth factor underperformed marginally.
On the contrary, weak performance cyclicality was observed for the 3-year earnings growth factor during the back-tested period. The factor showed modest outperformance in up markets and modest underperformance in down markets, with a return beta close to 1. Notably, the 3-year earnings growth factor showed statistically significant outperformance in neutral markets, with more than 70% outperformance probability.

In addition, the 3-year earnings growth factor showed a lower correlation (<0.20) with the 12-month price momentum and 3-year sales growth factors (see Exhibit 2). This differentiated performance across market cycles and low correlation with each other may serve as a basis to construct a composite growth factor portfolio combining the three examined factors.

All the three growth portfolios had high positive active exposure to their targeted factors. The 3-year sales growth and 3-year earnings growth portfolios had the highest exposure to the growth factor, whereas the 12-month price momentum portfolio had the highest active exposure to the mid-term momentum factor. The mid-term momentum factor contributed most to the excess return for the 3-year sales growth and 12-month momentum portfolios, while the profitability factor contributed the highest excess returns for the 3-year earnings growth portfolio (see Exhibit 3).
Unintended factor exposure was also observed among the growth portfolios; most notably, 12-month price momentum and 3-year sales growth portfolios had strong negative active exposure to the dividend yield factor, which was what dragged the performance of both these portfolios most significantly. These portfolios also had higher active exposure to volatility and market sensitivity (i.e., high return volatility and high beta, as observed in Exhibit 1). Higher volatility exposure had negatively affected the returns of the 12-month price momentum and 3-year sales growth portfolios.

In summary, the 12-month price momentum, 3-year sales growth, and 3-year earnings growth factors exhibited distinct performance cyclicality and unique factor exposure in the Australian small-cap equity market. The 12-month price momentum and 3-year sales growth factors showed pro-cyclical characteristics, whereas the 3-year earnings growth factor was much less cyclical. The unique industry factor exposure and style exposure help explain the performance differentials and excess return drivers of these portfolios over the long term.
1 12-month price momentum, 3-year earnings growth, and 3-year sales growth based on the S&P/ASX Small Ordinaries were studied for this analysis.
The posts on this blog are opinions, not advice. Please read our Disclaimers.


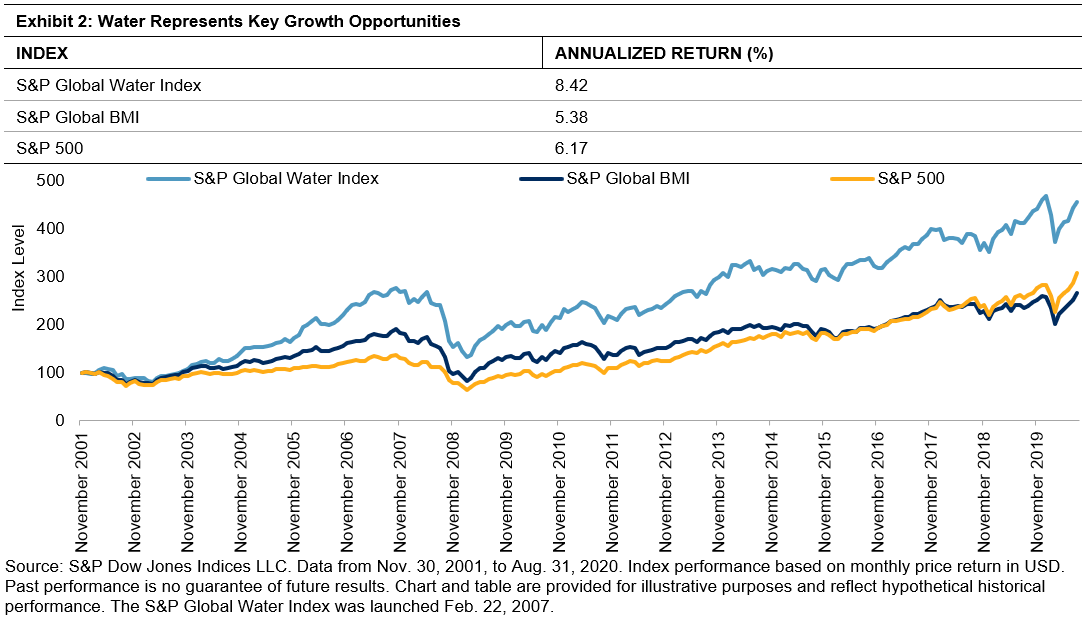
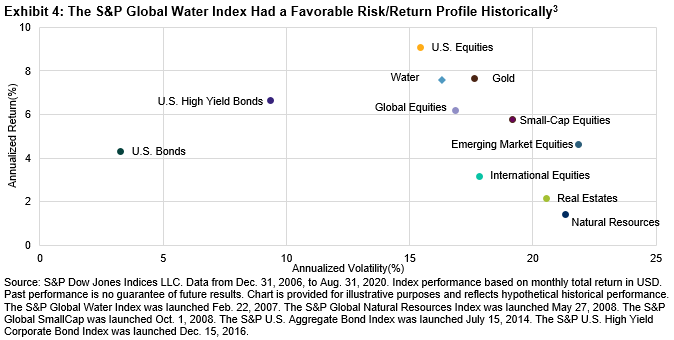
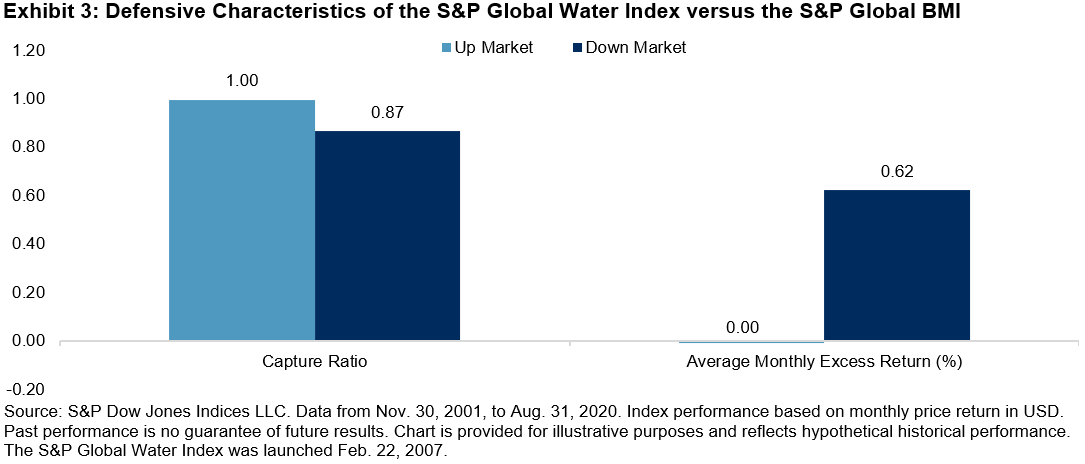 The S&P Global Water Index also provided favorable risk/return characteristics over the long run compared with key traditional asset classes, including real estate, small-cap equities, international equities, emerging market equities, and gold (see Exhibit 4). The favorable long-term risk/return characteristics compared with the