Get Indexology® Blog updates via email.

In This List

Did Australian Active Funds Outperform Benchmarks amid the COVID-19 Pandemic?

The Unmatched Value of a Consistent Approach to Global Benchmarking

A Second Wave Sinks Commodities in September

The S&P/B3 Brazil ESG Index – Introducing Sustainable Investing in Brazil

SPIVA® U.S. Mid-Year 2020 Scorecard: Convergence to Underperformance

Did Australian Active Funds Outperform Benchmarks amid the COVID-19 Pandemic?

Contributor Image
Priscilla Luk

Managing Director, Global Research & Design, APAC

S&P Dow Jones Indices

With the COVID-19 pandemic, equity markets around the world experienced massive declines with heightened volatility, and the Australian equity market was not immune. Various equity market segments experienced rapid market sell-offs followed by slow recoveries in H1 2020, with the S&P/ASX 200, S&P/ASX Mid-Small, and S&P/ASX 200 A-REIT decreasing 10.4%, 6.9%, and 21.3%, respectively.

Due to the volatile environment, stock return dispersion in global equity indices rocketed to historic highs in March,1 providing fertile ground for stock picking. Return spreads across the S&P/ASX 200 Sector Indices and S&P/ASX 200 Factor Indices were widened to 45.5% and 26.8% in H1 2020, respectively (see Exhibit 1). This market condition may prompt fund investors to question: did Australian active funds outperform benchmarks amid the COVID-19 pandemic?

The answer does not seem favorable for Australian active managers according to their fund performance versus the benchmark in H1 2020. In the recently published SPIVA® Australia Mid-Year 2020 Scorecard, we observed the majority of active funds had worse performance than their respective benchmark indices across most fund categories in H1 2020. Of funds in the Australian Equity General, Australia Equity Mid- and Small-Cap, and International Equity General categories, 64%, 56%, and 60% underperformed their benchmarks, respectively. The portion of underperforming funds was smallest in the Australian Equity A-REIT category, with 45% of funds underperforming the S&P/ASX 200 A-REIT. Australian Bonds was the only category that recorded a positive average return in H1 2020, though more than 70% of funds in this category failed to outperform the S&P/ASX Australian Fixed Interest 0+ Index.

All fund categories underperformed their respective benchmarks over the same period in terms of their equal- and asset-weighted returns. Despite mid- and small-cap funds delivering better average returns than the benchmark over longer time horizons, they recorded a larger average drawdown than the S&P/ASX Mid-Small in H1 2020. The asset-weighted returns exceeded the equal-weighted returns for the Australian Equity General and Australian Equity Mid- and Small-Cap fund categories, indicating larger equity funds tended to suffer less drawdowns during the COVID-19 crisis in these two categories.

During this volatile period, some active managers harvested the benefit of high stock return dispersion, but some were badly hurt. Equity fund return spreads were high in H1 2020, as most obviously seen among the Australian Mid- and Small-Cap funds and International Equity General funds, with the first and third quartile return breakpoints differing by 8.0 % and 8.4%, respectively. One-quarter of Australian Mid-Small-Cap funds outperformed the S&P/ASX Mid-Small by more than 2.5%, but one-quarter underperformed the benchmark by more than 5.5%. Among International Equity General funds, one-quarter delivered excess returns of more than 2.9%, though one-quarter of these funds lost more than 8.7%, which was more than double the benchmark’s drawdown (3.2%).

In our semiannual SPIVA Australia Scorecard, we have consistently observed underperformance for the majority of Australian active funds across most categories over time. The high market volatility seen during the COVID-19 crisis was an excellent time for active fund managers to reveal their portfolio skills, as record-high stock return dispersion resulted in a good opportunity for stock pickers to outperform. However, the results of the mid-year 2020 scorecard revealed that the majority of active fund managers failed to capture this opportunity.

1 For tables and charts on equity index dispersions in March 2020, see the Dispersion Dashboard: https://www.spglobal.com/spdji/en/documents/commentary/dashboard-dispersion-2020-03.pdf


The posts on this blog are opinions, not advice. Please read our Disclaimers.

The Unmatched Value of a Consistent Approach to Global Benchmarking

Contributor Image
John Welling

Senior Director, Head of Global Equity Indices

S&P Dow Jones Indices

Before making its permanent home at S&P DJI in 2004, the S&P Global BMI Series was introduced 15 years prior by Salomon Brothers in 1989. Although MSCI EAFE has the honor of being the first international equity index, the S&P Global BMI lays claim to a number of important firsts in the global indexing industry—the most important of these being that it was the first to incorporate float adjustment into the index methodology and to include large-, mid-, and small-cap constituents in a single, modular index series. In this regard, the S&P Global BMI set many of the key standards for modern global benchmark construction, as both MSCI and FTSE followed many years later in incorporating these core benchmark principles into their own index series (see Exhibit 1).

In our first blog in a series highlighting key features of the global equities benchmark landscape, we explore how the unmatched continuity and breadth of the S&P Global BMI historical data provides superior value to market participants.

Float adjustment—now the industry standard for equity benchmarks—is necessary to accurately reflect shares that are available to global investors. This is particularly important in many international markets where governments and other strategic holdings tend to represent a significant portion of total equity market cap.

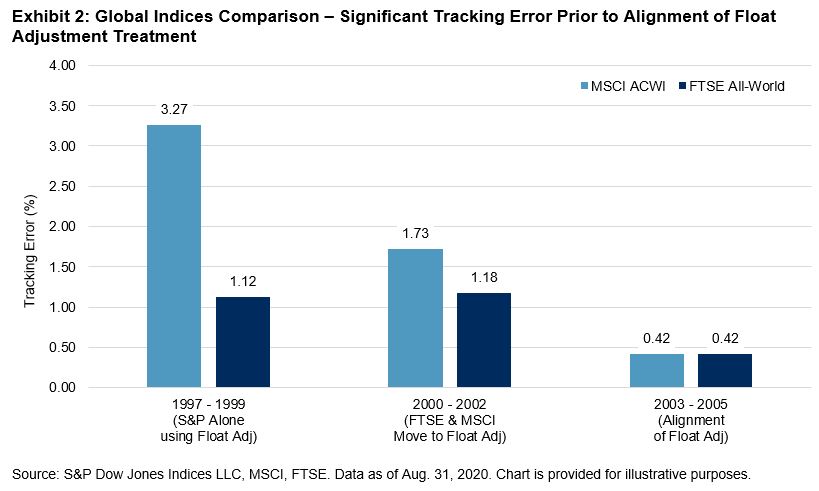
The relative stability derived from a consistent approach to float adjustment throughout history can be seen in the respective return series of similar global benchmarks (see Exhibit 2). Using the S&P Global LargeMidCap returns against competitor benchmarks, we compare the annualized tracking error in three consecutive three-year periods: 1) when S&P DJI was the only provider incorporating float adjustment; 2) during the MSCI and FTSE transition to float adjustment; and 3) after alignment. After 2001, once MSCI and FTSE completed the transition to float adjustment, the tracking error between the S&P Global LargeMidCap and the alternative indices was greatly reduced.

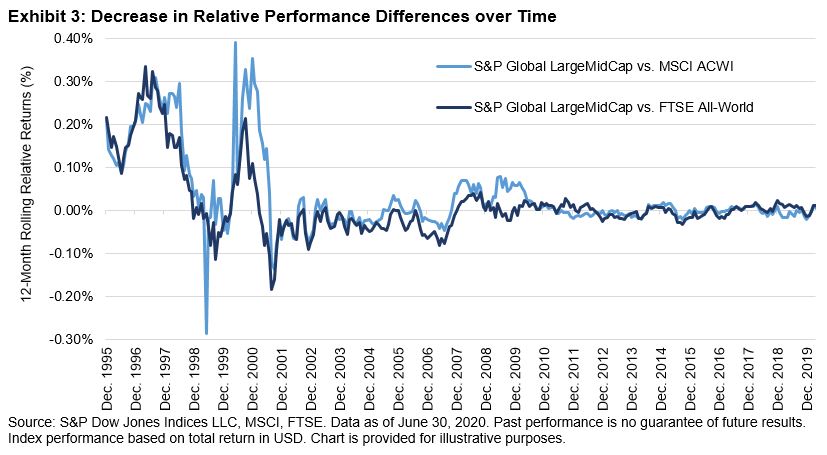
While the convergence of best practices by index providers has led to similar risk/return profiles of the indices in recent years (see Exhibit 3), users should be mindful of the differences that once existed. Significant breaks in methodology construction over time can introduce biases in historical index data, as the change in the methodology itself influences the characteristics and performance of the index.

The continuous inclusion of large-, mid-, and small-cap stocks in a single benchmark and consistent use of float adjustment since 1989 means the S&P Global BMI Series eliminates important sources of bias compared with other indices that have undergone fundamental methodology changes during more recent times. Even if a particular index is used for official benchmarking purposes, the S&P Global BMI Series may serve as a valuable secondary data source—particularly if one is seeking an optimal index universe for historical research purposes, such as to back-test global investment strategies.

For further reading, see The S&P Global BMI: Providing Consistent Insights into Global Equity Markets since 1989.

The posts on this blog are opinions, not advice. Please read our Disclaimers.

A Second Wave Sinks Commodities in September

Contributor Image
Fiona Boal

Managing Director, Global Head of Equities

S&P Dow Jones Indices

The headline S&P GSCI fell 3.6% in September on the back of growing concern regarding the prolonged economic impact of a second wave of the COVID-19 pandemic. Across sectors, both industrial metals and energy contracted, while the agriculture and livestock sectors benefited from cursory signs of the return of demand from China.

The S&P GSCI Petroleum fell 7.0% in September. An increase in OPEC supply since August and concerns of a new demand hit as coronavirus cases rise have weighed on oil prices. The oil market continues to emerge from the largest and most abrupt shock in its history, following the shutdown of the global economy caused by the global COVID-19 pandemic. The focus has now shifted to the market rebalancing, as well as the longer-term question regarding whether the shock represents a temporary aberration or a structural shift in supply and demand dynamics.

The S&P GSCI Industrial Metals reversed course in September, falling 2.2% after a strong August performance. The index was positive YTD, after a 9.8% gain for the third quarter. The two metals most closely linked to economic data, S&P GSCI Copper and S&P GSCI Aluminum, both had muted performance, reflecting at least a slight deterioration in economic sentiment and a strengthening U.S. dollar.

The S&P GSCI Gold dimmed in September by 4.2%, after reaching a new all-time high in August. Strength in the U.S. dollar and a slight drop in risk appetite pulled most asset classes down, as market participants reassessed the global economic outlook and may have liquidated some positions in favor of holding cash. Gold was still one of the best-performing commodities in 2020, up over 21% YTD.

The S&P GSCI Agriculture shuffled higher in September, up 4.0%. Bookings by top soybean buyer China were robust during the third quarter, pushing the S&P GSCI Soybeans up 7.4% for the month and into positive territory YTD. Coffee prices plunged as market participants weighed the prospect of bloated warehouse stocks in Brazil entering the market. The S&P GSCI Coffee fell 14.0%.

A recovery in demand from China as well as the discovery of African swine fever in Germany pushed the S&P GSCI Lean Hogs sharply higher in September, up 19.6%. China, South Korea, and Japan have banned pork shipments from Germany, which will likely redirect export demand to the U.S. over the following months.

The posts on this blog are opinions, not advice. Please read our Disclaimers.

The S&P/B3 Brazil ESG Index – Introducing Sustainable Investing in Brazil

Contributor Image
Cristopher Anguiano

Senior Analyst, U.S. Equity Indices

S&P Dow Jones Indices

The search for strategies that identify risks and growth opportunities with a motivation in sustainable investing has never been higher for emerging markets. Environmental, social, and governance (ESG) investing provides a way for investors to go above and beyond traditional financial considerations by focusing on a variety of impactful topics relevant to corporations. These topics include how companies interact with their employees, the communities they operate in, their commitment to the environment, and how they encourage change and innovation, to name a few.

The rapid growth and relevance of sustainable investing over the past years has made it a cornerstone in the investment selection process, so the presence of a broad ESG benchmark for the largest market in Latin America was necessary. Aimed toward ESG-oriented investors, S&P Dow Jones Indices launched on Aug. 31, 2020, the S&P/B3 Brazil ESG Index, an ESG-weighted index following a straight set of rules suitable for the Brazilian market, with a focus on sustainability and ESG principles similar to those of the S&P 500® ESG Index.

Using the S&P Brazil BMI as its underlying index, companies are excluded based on the following criteria:

  • Business activities related to tobacco, controversial weapons, and thermal coal;
  • United Nations Global Compact (UNGC) non-compliance;1
  • S&P DJI ESG Score; and
  • Media and stakeholder analysis controversies.

In the most recent rebalance on April 30, 2020, the resulting universe consisted of 96 constituents.

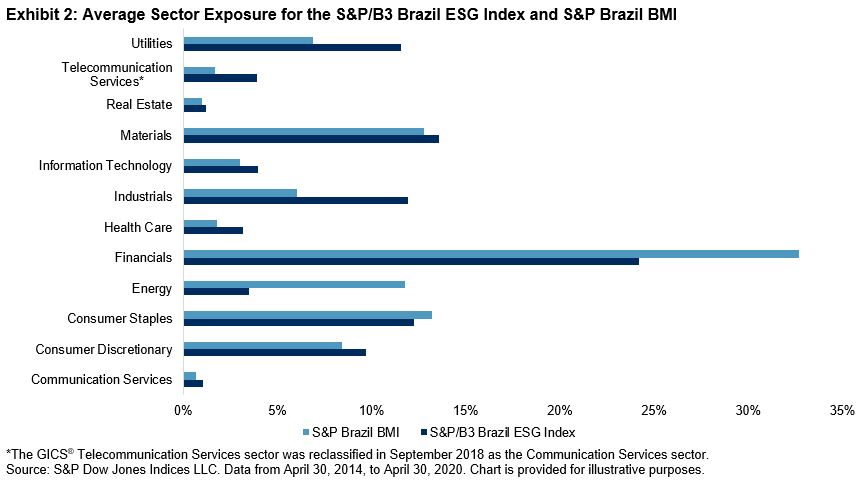
Companies are weighted by ESG score, which is subject to a liquidity cap aimed to improve liquidity. During the April 2020 rebalance, examining 25% of the past six months’ median value traded shows that a BRL one billion ticket can be traded on average in less than one day. In addition, average sector exposure decreased for Consumer Staples, Energy, and Financials. In contrast, all other sectors’ exposure increased.

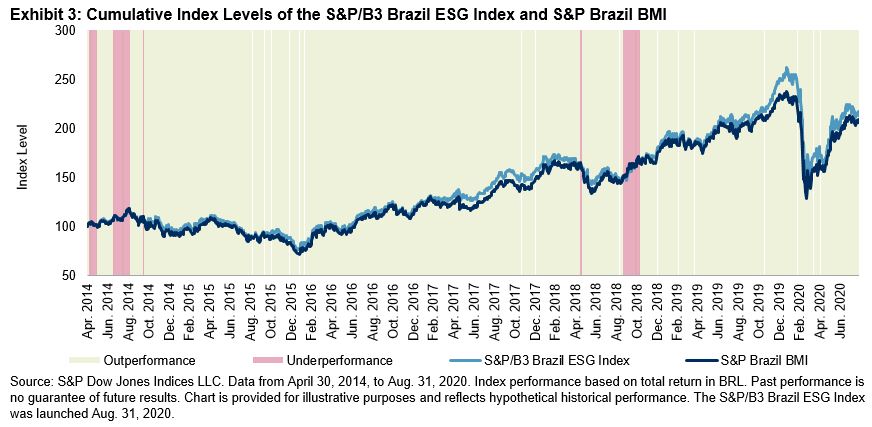
The index moves similar to its benchmark and exhibits an average annualized beta of 0.9 and annualized tracking error that oscillates around 6%. In March 2020, the S&P/B3 Brazil ESG Index experienced an increase in beta and tracking error, displaying a beta close to 1 and a 6.5% tracking error due to the COVID-19 pandemic, when global markets suffered large losses. We can see this movement in the cumulative level chart in Exhibit 3 at the end of Q1 2020. It is relevant to highlight that the strategy not only achieved a risk/return profile similar to that of the S&P Brazil BMI, it also outperformed in more than 90% of the historical observations.

From an ESG perspective, the S&P/B3 Brazil ESG Index was able to improve its ESG score relative to that of the S&P Brazil BMI. During its most recent rebalance, the overall ESG score of the S&P/B3 Brazil ESG Index increased from 47.9 to 57.7, an improvement of 9.8 points; considering that the maximum attainable ESG score of any strategy using the S&P Brazil BMI is 95.9, the ESG realized potential was 20.4%.

Overall, the S&P/B3 Brazil ESG Index is designed to be an alternative for investors that are looking for exposure to the broad Brazilian equities market while maintaining a focus on responsible investing, without losing the benefits of performance and liquidity.

The posts on this blog are opinions, not advice. Please read our Disclaimers.

SPIVA® U.S. Mid-Year 2020 Scorecard: Convergence to Underperformance

Contributor Image
Berlinda Liu

Former Director, Multi-Asset Indices

S&P Dow Jones Indices

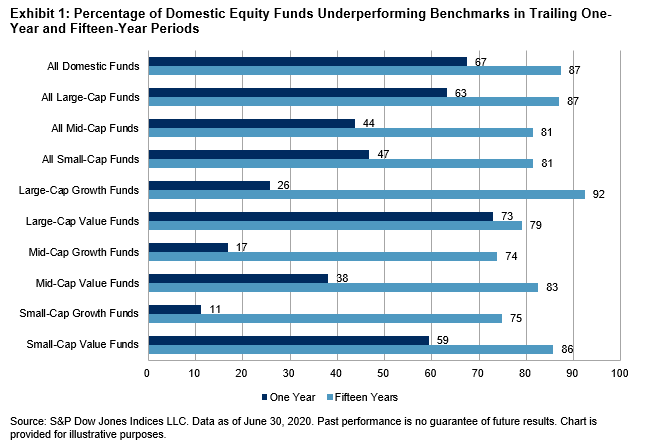
According to the SPIVA U.S. Mid-Year 2020 Scorecard, most active fund managers in the U.S. underperformed the market over the past year. Among actively managed domestic equity funds, 67% lagged the S&P Composite 1500® during the 12 months ending June 30, 2020, and the majority of active managers underperformed their benchmarks in 11 out of the 18 categories of domestic equity funds.

The past year was marked by performance divergence and extreme volatility. For example, while the majority of large-cap and multi-cap funds lagged their benchmarks, mid-cap and small-cap active funds performed better. Similarly, growth funds led across all capitalization segments in the one-year period, while value funds in general continued to lag their benchmarks over all time horizons (see Exhibit 1).

Despite divergent results over the one-year horizon, median fund managers across all domestic equity categories underperformed their benchmarks over the past 15 years. This is not surprising–our latest Fleeting Alpha report shows that, even if an active fund manages to beat the benchmark in one period, it is difficult to keep its positive excess return in the following years. In longer investment horizons, the standard deviation of active fund returns tends to diminish; eventually, a fund’s returns start to resemble a normal distribution with its median below the benchmark’s return.

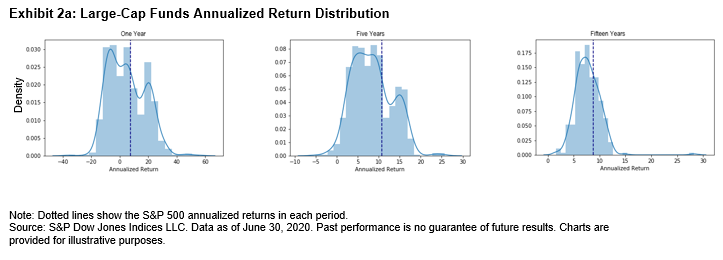
Taking large-cap funds as an example, Exhibit 2a plots the distribution of annualized fund returns in the past 1-, 5-, and 15-year periods, with the S&P 500® annualized returns shown as the dotted lines. In the one-year period, most funds can be sorted into discrete and distinct groups of winners and losers relative to the benchmark. However, as the investment horizon lengthens, these two groups gradually converge and the returns from all funds resemble a continuous normal distribution despite its long tail and skew. Exhibit 2b further confirms that the standard deviation of fund returns decreases steadily as the investment horizon lengthens. In all periods, the average and median large-cap managers underperformed the benchmark.

Data from the SPIVA Mid-Year 2020 Scorecard are clear: short-term outperformance tends not to persist. The most likely path for short-term outperformers is convergence to mediocrity, as most actively managed mutual funds fall short of benchmark returns in the long run.

The posts on this blog are opinions, not advice. Please read our Disclaimers.