Get Indexology® Blog updates via email.

In This List

Impact of Inflation Expectations on Retirement Income

How Are Insurance Companies Using ETFs Today?

The Less Precious Metal

Why Should You Diversify?

Q2 2020 Performance Review for the S&P Risk Parity Indices

Impact of Inflation Expectations on Retirement Income

Contributor Image
Hamish Preston

Head of U.S. Equities

S&P Dow Jones Indices

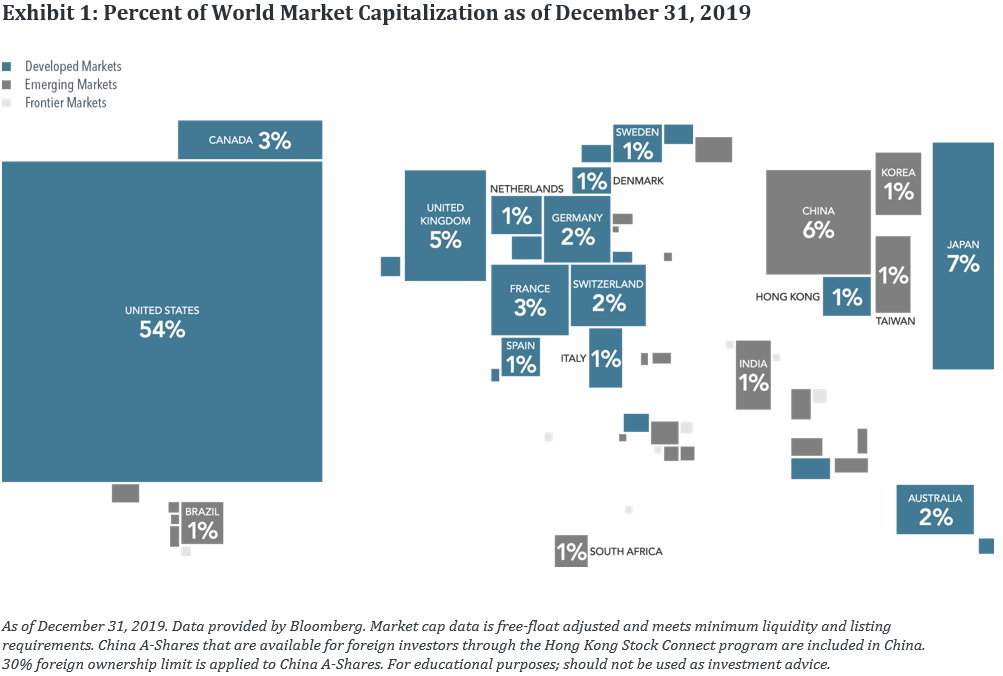
Our latest S&P STRIDE dashboard showed a dramatic increase in the cost of retirement income for various retirement dates (vintages) in Q2.  For example, the present value of an inflation-adjusted stream of cash flows equal to USD 1 per year – or USD 1/12 per month – starting in 2065 and ending 25 years later, rose 19.07% since March.  This increase nearly matched the S&P Composite 1500’s 20.8% quarterly gain.

Even more striking was the fact that the cost of retirement income rose above USD 25 for most vintages, the first time any such measure recorded a quarter-end reading above USD 25 (based on data since January 2016). A key driver of this observation was negative real interest rates.

Calculating the present value of inflation-adjusted cash flows requires us to use real interest rates for discounting; “real” meaning that they account for inflation expectations.  Exhibit 2 shows the real yield curve at the end of June.  Appendix II in the S&P STRIDE index series methodology outlines the process for constructing the curve but suffice to say that it is calculated by:

  • Using data from six S&P U.S. TIPS indices (1-5 years, 7-10 years, 10 years, 10-15 years, 15 years plus, 30 years) to obtain real interest rates across various maturities, and;
  • Interpolating to obtain the entire real yield curve.

The yield curve is assumed to be flat for maturities that are shorter than the duration of the S&P 1-5 Year U.S. TIPS index (approx. 3 years) and longer than the duration of the S&P 30 Year U.S. TIPS index (approx. 30 years).  This means the 3-year and 30-year real interest rates are used to discount hypothetical monthly payments in the near-term and very far into the future, respectively.

Exhibit 2 shows that the entire U.S. real yield curve was negative at the end of June. Hence, the present value of each hypothetical monthly payment was greater than USD 1/12, resulting in cost of retirement income figures over USD 25 for most vintages. 2005, 2010 and 2015 offered the exceptions as the post-retirement vintages have fewer than 25 years of payments remaining.

The Fisher equation tells us that real interest rates can be approximated by the difference between nominal interest rates and inflation expectations: real interest rates rise as nominal interest rates rise or inflation expectations fall, and vice versa.  Since nominal U.S. interest rates were low and stable in Q2, negative real interest rates and the recent increases in cost of retirement income appear to reflect investors’ rising inflation expectations.

The sizeable monetary stimulus likely fueled this as economic theory tells us that, all else equal, increases in the money supply are inflationary – in theory, giving people additional money to spend drives up demand for goods, causing prices to rise.

Of course, inflation may not rise as expected: people made similar predictions following central bank intervention during the Financial Crisis. Nonetheless, since one of the main risks for retirees is not having enough inflation-adjusted retirement income to support their desired standard of living, investors may wish to consider retirement strategies that have an explicit focus on reducing the volatility of retirement income – such as the S&P STRIDE index series.  Indeed, post-retirement S&P STRIDE vintages have far higher TIPS allocations than their S&P Target Date counterparts, making them more insulated against changes in expected inflation.

To sign up for the S&P STRIDE: Cost of Retirement Income dashboard, please use this link.

The posts on this blog are opinions, not advice. Please read our Disclaimers.

How Are Insurance Companies Using ETFs Today?

Insurance companies continue to increase their ETF usage to serve a broad range of functions within their general account portfolios. Explore some of the most recent holding and transaction trends with S&P DJI’s Raghu Ramachandran and Kelsey Stokes.


Read the full reports to learn more about how insurance companies are using ETFs in their general account portfolios:

https://www.spglobal.com/spdji/en/research/article/etfs-in-insurance-general-accounts

https://www.spglobal.com/spdji/en/research/article/etf-transactions-by-us-insurers-in-q1-2020

The posts on this blog are opinions, not advice. Please read our Disclaimers.

The Less Precious Metal

Contributor Image
Jim Wiederhold

Former Director, Commodities and Real Assets

S&P Dow Jones Indices

Silver has soared since mid-March 2020, fueled by renewed industrial demand and investor appetite for alternatives to gold and government bonds. From its low in mid-March, the S&P GSCI Silver was up 65% as of July 17, 2020. The less precious metal, silver, has lagged gold’s recent multi-year increase. The more volatile precious metal has historically overshot moves in gold prices (see Exhibit 1). This can occur before or after a large move in gold, so it does not always occur with a lag. Notice the outsized move of silver from September 2008 to April 2011. Is this time different?

Over the past 20 years, silver’s monthly correlation to gold was 0.75—quite high, but not perfect. There is an important reason why silver isn’t perfectly correlated to gold. Industrial use is much higher for silver, accounting for more than 50% of demand. Investment demand for silver has risen over the past three years from a 10-year low, but it still only accounts for about half of the industrial demand. Typical industrial uses for silver include solar panels, automotive components, and medical devices. Although gradual, there has been a steady decline in the industrial use of silver over the past 10 years.

As of July 17, 2020, the S&P GSCI Silver was up 6.1% for the month, twice as strong as the S&P GSCI Gold’s return. Is this the start of a higher beta move for the less precious metal after a few years of directionless prices? It is too early to tell, and with the global pandemic still raging in many countries, the future is tenuous. The S&P GSCI Industrial Metals was also higher this month, in line with the move in silver, so this recent move could be explained by the economic optimism boosting certain metals on the back of promising COVID-19 vaccine trials.

If the last major disruptive event of the past 15 years is any indication, a bullish environment for gold typically opens the door to bullish price action for silver. Market participants diversified some of their gold holdings to silver in previous scenarios, and such flows tended to cause outsized moves in the much smaller silver market. It is important for market participants to be aware that the silver market is smaller and typically more volatile than the gold market.

S&P DJI calculates many variations of indices tracking the silver market, including inverse and leveraged indices such as the S&P GSCI Silver 2X Leveraged, which was up 12.1% for the month as of July 17, 2020, and back in positive territory YTD. Looking to commodities to diversify an investment portfolio could provide a silver lining in the second half of 2020.

The posts on this blog are opinions, not advice. Please read our Disclaimers.

Why Should You Diversify?

Contributor Image
Wes Crill

Vice President, Research

Dimensional Fund Advisors

When international stock returns lag, investors may feel tempted to double down on their home market. Historical data suggests the long-term benefits of diversifying globally.

With US stocks outperforming non-US stocks in recent years, some investors have again turned their attention toward the role that global diversification plays in their portfolios. In the five-year period ending March 31, 2020, the S&P 500 Index had an annualized return of 6.73%, while the S&P Developed Ex-US BMI (broad market index) lost 0.05% and the S&P Emerging BMI added 0.07%.

While there may be reasons why US-based investors would prefer a degree of home bias in their equity allocation, using return differences over a relatively short period as the sole input into this decision may result in missing opportunities that the global markets offer. It is important to remember that:

1) Non-US stocks help provide valuable diversification benefits.

2) Recent performance is not a reliable indicator of future returns.

There’s a World of Opportunity in Equities

The global equity market is large and represents a world of investment opportunities. As shown in Exhibit 1, nearly half of the investment opportunities in global equity markets lie outside the US. Non-US stocks, including developed and emerging markets, account for 46% of world market capitalization1 and represent thousands of companies in countries all over the world. A portfolio investing solely within the US would not capture the performance of those markets.

The Lost Decade

Recent history provides us with a valuable lesson on the importance of diversifying globally. The period from January 2000 to December 2009 is often called the “lost decade” by US investors, as the S&P 500 Index recorded one of its worst 10-year performances with a total cumulative return of    –9.1%. However, looking beyond US equities, conditions were more favorable for global equity investors as major indexes outside the US generated positive returns over the course of the decade (see Exhibit 2.)

Pick a Country?

It only takes a cursory glance at the randomness of country stock market performance to understand the futility of using past performance as an input to asset allocation decisions. Exhibit 3 illustrates country equity market rankings (from highest to lowest) for 22 different developed market countries over the past 20 years. Notably, US stocks never once placed at the top over this period and finished in the bottom half in 10 of the 20 years.

In addition, concentrating a portfolio in any one country can expose investors to large variations in returns. The difference between the best- and worst‑performing countries can be stark. For example, since 2000, the average return of the best‑performing developed market country was approximately 33% while the average return of the worst-performing country was approximately –13%. Diversification can spare investors the most extreme outcomes, helping provide more consistent returns.

A Diversified Approach

Over long periods, investors saving for retirement may benefit from consistent exposure in their portfolios to both US and non-US equities. While both asset classes offer the potential to earn positive expected returns in the long run, they may perform quite differently over short periods. While the performance of different countries and asset classes will vary over time, there is no reliable evidence that this performance can be predicted. An approach to equity investing that uses the global opportunity set available to investors can provide diversification benefits as well as potentially higher expected returns. 

  1. The total market value of a company’s outstanding shares, computed as price times shares outstanding.
Dimensional Fund Advisors LP is an investment advisor registered with the Securities and Exchange Commission.
Indices are not available for direct investment. Their performance does not reflect the expenses associated with the management of an actual portfolio. Past performance is not a guarantee of future results. Diversification does not eliminate the risk of market loss.
There is no guarantee investment strategies will be successful. Investing involves risks, including possible loss of principal. Investors should talk to their financial advisor prior to making any investment decision.
All expressions of opinion are subject to change. This article is distributed for informational purposes, and it is not to be construed as an offer, solicitation, recommendation, or endorsement of any particular security, products, or services.

The posts on this blog are opinions, not advice. Please read our Disclaimers.

Q2 2020 Performance Review for the S&P Risk Parity Indices

Contributor Image
Rupert Watts

Head of Factors and Dividends

S&P Dow Jones Indices

Risk appetite returned in the second quarter of 2020, spurred by the easing of COVID-19 lockdowns and aggressive economic stimulus measures. The S&P 500® rebounded, finishing the quarter up 20.5%, and yields on U.S. Treasuries saw little change. In commodities, the S&P GSCI rallied, with energy posting a sharp gain as oil-producing countries agreed on temporary production cuts.

During this time, the S&P Risk Parity Indices recovered most of the ground lost in the first quarter of 2020 (see Exhibit 1). The S&P Risk Parity Index – 10% Target Volatility posted a gain of 11.8% in the second quarter and was down 3.5% for the first half of the year.

Notably, the performance of the S&P Risk Parity Indices exceeded that of the manager composite, which is represented by the HFR Risk Parity Vol 10 Index. For reference, the HFR Risk Parity Indices represent the weighted average performance of the universe of active fund managers employing an equal risk-contribution approach in their portfolio construction.

While the S&P Risk Parity Index – 10% Target Volatility was on par with the HFR Risk Parity Vol 10 Index in the first quarter, it significantly outperformed in the second quarter by 4.9% (see Exhibit 2).

While it is hard to pinpoint the exact source of outperformance, the S&P Risk Parity Indices were well positioned to benefit from the rebound. Since they utilize a long look-back window (15 years) to determine asset class weights and leverage, their allocations remained fairly consistent throughout 2020.

As Exhibit 3 shows, the normalized asset class weights remained relatively unchanged YTD. Furthermore, the leverage decreased only slightly following the volatility spike in March 2020, meaning the S&P Risk Parity Indices did not miss out on the recovery in the second quarter.

It is also interesting to examine the asset class performance attribution of the S&P Risk Parity Index – 10% Target Volatility (using excess returns). The S&P Risk Parity Indices comprise three asset class sub-components: equities, fixed income, and commodities.

As Exhibit 4 shows, the positive performance in the second quarter of 2020 was driven by commodities and equities, up 3.6% and 7.3%, respectively. Year-to-date, the fixed income component posted meaningful positive performance, up 7.6%, but this was not enough to completely offset the other asset classes, particularly commodities, which was down 8.7% over the first half of the year.

Following the historic first two quarters for markets in 2020, it’s anyone’s guess as to what the rest of the year will bring. Investors will have to weigh reasons for optimism with reasons for caution. A well-diversified portfolio such as our S&P Risk Parity Indices may be appealing to those who don’t want to put all their eggs in one basket.

The posts on this blog are opinions, not advice. Please read our Disclaimers.