Get Indexology® Blog updates via email.

In This List

What Is in Store for S&P 500® Dividends? Only Time and the Pace of Recovery Will Tell

Global Islamic Indices Outperformed Benchmark by Nearly 10% in H1 2020: Examining the Key Drivers

Did Latin American Active Managers Outperform in This Tumultuous Time?

Battle of Factors: Low Volatility versus High Beta

A YTD History of S&P 500® Dividend Increases, Cuts, and Suspensions

What Is in Store for S&P 500® Dividends? Only Time and the Pace of Recovery Will Tell

Contributor Image
Howard Silverblatt

Senior Index Analyst, Product Management

S&P Dow Jones Indices

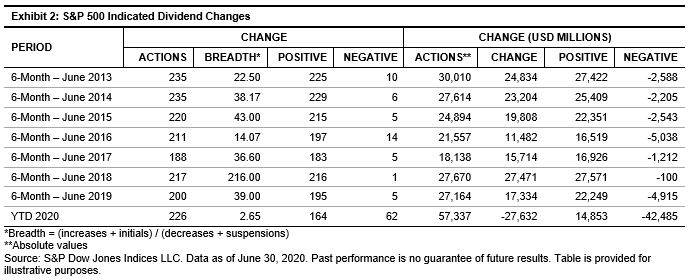
In the first half of 2020, the total amount of dividends paid out by S&P 500 companies rose 5.1% on a year-over-year basis (see A YTD History of S&P 500® Dividend Increases, Cuts, and Suspensions). However, the forward declarations for Q3 2020 show a decline. With 84% declared for July 2020, the month is poised to post a 4% payment decline (year over year). Based on the current public statements (and expected schedules), August is expected to post a 10% decline, with September showing a slight tick up (0.1%), leaving Q3 down 5% compared with Q3 2019.

The reality of Q3 2020 should start hitting market participants soon as companies declare their Q3 dividends (almost 70% of the issues are scheduled to report earnings in July 2020, with dividends typically around the release date). Big banks are expected to continue paying their rate (helped by the additional liquidity from suspending buybacks), with the exception of Wells Fargo, which decreased its rate, following the Federal Reserve’s stress test results.

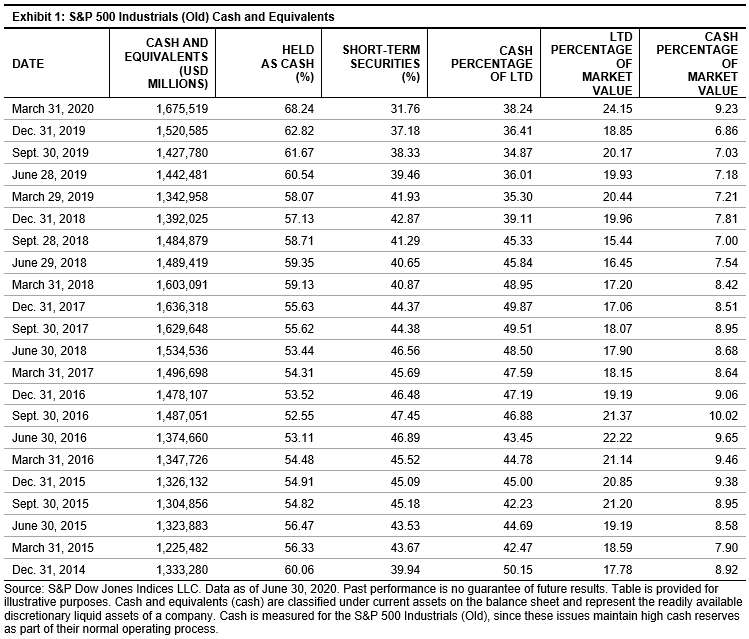
The market is expecting much smaller increases for those increasing, with one penny now being the new wink. As for cuts, we expect few within the S&P 500 for the current Q3 period (but more than the historical average), as companies wade through the reopening and their cash flow (and cash burn). Of note, S&P 500 Industrials (Old)[1] issues had a record amount of cash reserves at the end of Q1 2020 (USD 1.68 trillion) and have been adding to those reserves via issuance (which has affected the divisor, especially with fewer buybacks) and debt, as liquidity remains a top priority.

For many market participants, the Q4 2020 payments remain more of a guessing game. If one takes a bullish approach toward the overall recovery and regions’ ability to limit the further spread of the virus, then the base estimate is for a 7%-8% year-over-year Q4 2020 decline in actual payments, assuming companies with a history of increasing payments would continue to do so, be it at a much lower rate.

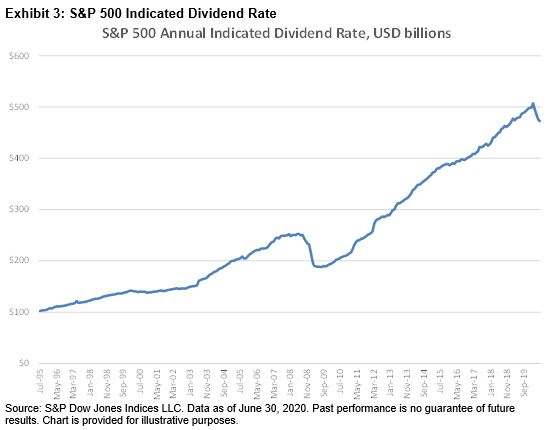
In the near term, we do not anticipate dividend figures materially improving, as companies will likely remain careful with cash flows. Hence, after a record Q1 2020 payment, an impressive Q2 2020 payment, and calculating reduced Q3 and Q4 payments, the current working estimate for the S&P 500 2020 payment has improved to a modest 2% decline in the actual payment.

So, what is the picture for 2021 dividends? Before projecting for 2021, we must get through 2020 first, with the U.S. presidential election right around the corner. Politics, particularly tax policy, plays a significant role for dividends, similar to the economy. The August 2020 Democratic and Republican conventions and party policy platforms will give some insight, as the presidential and congressional election results will shore up the view (and market reaction). As for the economy, to some degree, the ability of regions to contain the current outbreak, as well as the depth and duration of the spread over the summer, and the development of drugs (to control or restrict the virus, or at least move the penalty for infection out of the death column) should dictate consumer behavior, which in turn drives the economy and the market.

[1]   The S&P 500 Industrials (Old) consists of the S&P 500 minus Financials, Real Estate (which was part of Financials), Utilities, and Transportation (which is now a subgroup of the GICS® Industrials sector. Note the S&P 500 Industrials (Old) dates back for decades, so when the GICS classifications were developed and one of the new sectors was Industrials, the former group was referred to as the S&P 500 Industrials (Old).

The posts on this blog are opinions, not advice. Please read our Disclaimers.

Global Islamic Indices Outperformed Benchmark by Nearly 10% in H1 2020: Examining the Key Drivers

Contributor Image
John Welling

Director, Global Equity Indices

S&P Dow Jones Indices

Global equities rallied during Q2 2020, gaining 20% as measured by the S&P Global BMI. Shariah-compliant benchmarks, meanwhile, including the S&P Global BMI Shariah and Dow Jones Islamic Market (DJIM) World Index, significantly outperformed—entering positive territory YTD—well ahead of the 6.8% decline of the S&P Global BMI (see Exhibit 1). The outperformance trend played out across all major regions, with the DJIM World Emerging Markets Index leading the pack, providing an additional 13.1% return above the conventional benchmark.

Sector Performance a Key Driver

Amid the Q2 equity market recovery, sector drivers continued to play an important role in Shariah outperformance, as Information Technology—which tends to be overweight in Islamic indices—outperformed among sectors, while Financials—which is underrepresented in Islamic indices—heavily underperformed the broader market. Exhibit 2 demonstrates the effect of returns of over- and underweight sector allocations of the S&P Global BMI Shariah compared with the conventional benchmark. A majority of outperformance—5.8% of the 9.1% total outperformance YTD—is explained by differing sector allocations, while 3.3% is explained by stock selection differences within sectors.

Shariah-Compliant Indices Reveal Momentum, Large Size, and Profitability Characteristics

 While sector preferences of Shariah-compliant indices explain a degree of outperformance, a review of the Axioma style factor characteristics YTD highlights the more dominant characteristics of included companies. The preference for companies oriented toward momentum, large size, and profitability—while avoiding companies whose performance is largely driven by factors including value, yield, and leverage—allowed Islamic indices to excel during the current market environment.

For more information on how Shariah-compliant benchmarks performed in Q2 2020, read our latest Shariah Scorecard.

This article was first published in Islamic Finance news Volume 17 Issue 28 dated the 15th July 2020.

The posts on this blog are opinions, not advice. Please read our Disclaimers.

Did Latin American Active Managers Outperform in This Tumultuous Time?

Contributor Image
Maria Sanchez

Director, Sustainability Index Product Management, U.S. Equity Indices

S&P Dow Jones Indices

Low volatility and dispersion make it harder for active managers to add value. In other words, high volatility and high dispersion environments are expected to favor active managers to demonstrate their skill. In this aspect, March 2020 offered an opportunity to active managers[1] across the world, including in Latin American equity markets. High dispersion and volatility extended through May 2020.

Despite the circumstances, the majority of equity active managers in Brazil and Chile failed to outperform their respective benchmarks in 2020. While the strong performance of Brazil Large-Cap Funds shown in the SPIVA® Latin America Scorecard Year-End 2019 continued in the one- and three-year periods ending May 31, 2020, on a long-term basis, it was not so.

During Q1 2020, Brazil Mid-/Small-Cap Funds outperformed, which could be based on stock selection skill or a style drift across the capitalization scale. Given that over the longer term, a majority (88% for the 10-year period) of Brazil Mid-/Small-Cap Fund active managers were not able to outperform their benchmark, it’s more likely that the Q1 2020 success was due to style drift, incorporating some larger companies in the fund composition.[2]

Asset-weighted returns were generally lower than equal-weighted returns, suggesting that the first quarter was more challenging for larger funds across Latin American countries.

Mixed early 2020 results in the short term highlighted the difficulty of timing the market. For the first quarter, the majority of Brazil Mid-/Small-Cap Funds beat their respective benchmark. In the period from January to May 2020, Mexican equity active funds were the only ones that mostly outperformed their benchmark. Lastly, in the one-year period ending May 31, 2020, the success story was in the hands of Brazil Equity Funds and Brazil Large-Cap Funds.

The results were not just varied in the short term but ephemeral, since in the longer-term 5- and 10-year periods, a majority of actively managed funds underperformed their respective benchmarks across countries and styles.

As volatility remains high and dispersion above average, let’s see if results are more favorable for active managers in the next SPIVA® Latin-America Mid-Year 2020 Scorecard.

[1] Index Dashboard: Dispersion, Volatility & Correlation March 2020

[2] Performance Trickery, Part 3

The posts on this blog are opinions, not advice. Please read our Disclaimers.

Battle of Factors: Low Volatility versus High Beta

Contributor Image
Pavel Vaynshtok

Former Managing Director, Global Head of Strategy Indices

S&P Dow Jones Indices

2020 has surprised us all with a number of firsts. Not only did we witness wild swings in the market from one quarter to the next, we also saw an unusual performance of commonly followed factors. While this blog will not attempt to predict factor performance, it will address recent factor behavior and put this behavior into historical context.

The magnitude of market returns during Q2 2020 was impressive, with the S&P 500® returning 20.5% for the quarter. This comes on the heels of a similarly dramatic, albeit negative, showing during Q1 2020, when the index fell by 19.6%. The whipsawing of the market from one quarter to the next is extraordinary when compared with the historical median S&P 500 quarterly return of 3.5% and a median Q2 return of 3.2% (see Exhibit 1).

Factor performance was just as extreme and, in many cases, nearly a mirror opposite of Q1 2020. The S&P 500 High Beta Index (High Beta) and S&P 500 Low Volatility Index (Low Volatility) were the noteworthy outliers during Q2 2020. While High Beta staged a strong comeback, Low Volatility lagged the market and was the worst-performing factor.

It is perhaps not surprising that these factors exhibited the behavior that they did in the Q2 2020. After all, High Beta’s historical return dispersion was the highest among the factors analyzed, while Low Volatility’s dispersion was the lowest (see Exhibit 2). The relative magnitude of their respective bounceback in Q2 2020 makes sense in the context of these factors’ historical return dispersions.

In a further display of how anomalous this past quarter was, Exhibit 2 highlights that nearly every factor’s return was at the extreme of its historical distribution, with a notable exception of the S&P 500 High Dividend Index. We wrote earlier about the reasons for the disappointing performance of dividends in Q1 2020[1] (the underperformance of defensive sectors and low volatility, and the outperformance of growth over value). The bounceback of dividends in Q2 2020 was underwhelming, driven by some of the same dynamics that carried over from Q1 2020.

With High Beta and Low Volatility near the extremes of their historical performance, how have these strategies fared over the long term? High Beta is a curiosity. The Capital Asset Pricing Model[2] tells us that a security’s return should be proportional to its risk. Yet, High Beta’s historical performance has been disappointing (see Exhibit 3). Low Volatility, on the other hand, has had superior risk-adjusted returns, despite its mediocre absolute return profile. The power of Low Volatility has consistently come from its low return dispersion—with smaller drawdowns, the factor has less to gain back after a tough period than a factor with larger drawdowns.

The longer-term return differential between High Beta and Low Volatility is striking (see Exhibit 4). High Beta did indeed have its time in the sun, but the dot-com period of 1998-2000 was relatively brief. The exhibit is truly a testament to the power of compounding and long-term holding discipline. While the Q2 2020 resulted in unexpected returns for many factors, it is the anomalous performance of High Beta and Low Volatility that should give a pause to market players chasing short-term performance.

[1] Cheng, “Why Did Dividend Indices Underperform during the Coronavirus Sell-Off?” 2020

[2] https://en.wikipedia.org/wiki/Capital_asset_pricing_model

The posts on this blog are opinions, not advice. Please read our Disclaimers.

A YTD History of S&P 500® Dividend Increases, Cuts, and Suspensions

Contributor Image
Howard Silverblatt

Senior Index Analyst, Product Management

S&P Dow Jones Indices

Back in mid-February 2020, S&P 500 issues were easily on track to set their ninth annual record for dividend cash payments, as forecasts called for double-digit 2020 returns. By month-end February, 113 issues in the S&P 500, 22% of the index, had increased their dividends, with no cuts (and certainly no suspensions), and Q1 2020 went on to return a record USD 127 billion of cash payments to holders.

All was good until the word “corona” turned from a beer order into a virus. By the end of June, four months later, the index posted 49 additional increases (with lower increases; the Q2 2020 average increase was 7.50% versus Q1 2020’s 9.01% and Q2 2019’s 11.03%), along with 62 decreases, with 41 of the 62 being suspensions (the last suspension was in 2017 by PG&E). Still, the Q2 2020 payments held up, as companies fulfilled their prior declarations, returning USD 119 billion to holders. The amount was higher on a year-over-year basis (0.3% over Q2 2019), but 6.2% lower than the record Q1 2020 payment. Because of the record Q1 2020 payment, the payment for the first half of 2020 was 5.1% higher on a year-over-year basis.

However, the announcements of Q2 2020 payments that started in March paint a different picture of the second half of 2020. The first half produced USD 14.9 billion in announced increases and USD 42.5 billion in cuts, resulting in a USD 27.6 billion reduction in dividends, with the immediate result of lower declared payments for Q3 and Q4 2020.

If one thinks of dividends as a paycheck, a 25-year wage growth, compounded using actual cash payments, amounts to 6.4% annualized. The annualized growth from the full recovery from the financial downturn to YTD was higher, at 7.6%. From February 2020, when dividend rates reached an all time high, to now, the drop was equivalent to taking a 6.8% pay cut.

At the moment, the 2020 estimate for payments from S&P 500 issues has improved to a 2% decline in the actual 2020 payment over 2019, compared with May’s decline estimate of a 3%-4% decline. The last down dividend year for the index was in 2009 (-21.07%).

Taken all together, the swift dividend cuts and suspensions have overpowered smaller and fewer increases for S&P 500 companies. Going forward, if the reopening continues to be positive for the economy, the major damage of cuts and suspensions could be behind us. It is worth noting that while the current working estimate for S&P 500 issues has improved, it remains contingent on the reopening.

The posts on this blog are opinions, not advice. Please read our Disclaimers.