Get Indexology® Blog updates via email.

In This List

IRONclad ORE Is Full of Steam

Introducing the Dow Jones Equity All REIT Capped Index

2020 – The Dawn of the Passive Investing Era in India: Part One

Active Managers: No Place to Hide

Looking Under the Hood of S&P 500 Information Technology Performance

IRONclad ORE Is Full of Steam

Contributor Image
Jim Wiederhold

Former Director, Commodities and Real Assets

S&P Dow Jones Indices

Just like the ironclad battleships of the 19th century, the S&P GSCI Iron Ore has steamed through 2020 in the explosive sea battle atmosphere of this year’s highly volatile markets. It stayed afloat when most commodities sunk to negative YTD returns (see Exhibit 1).

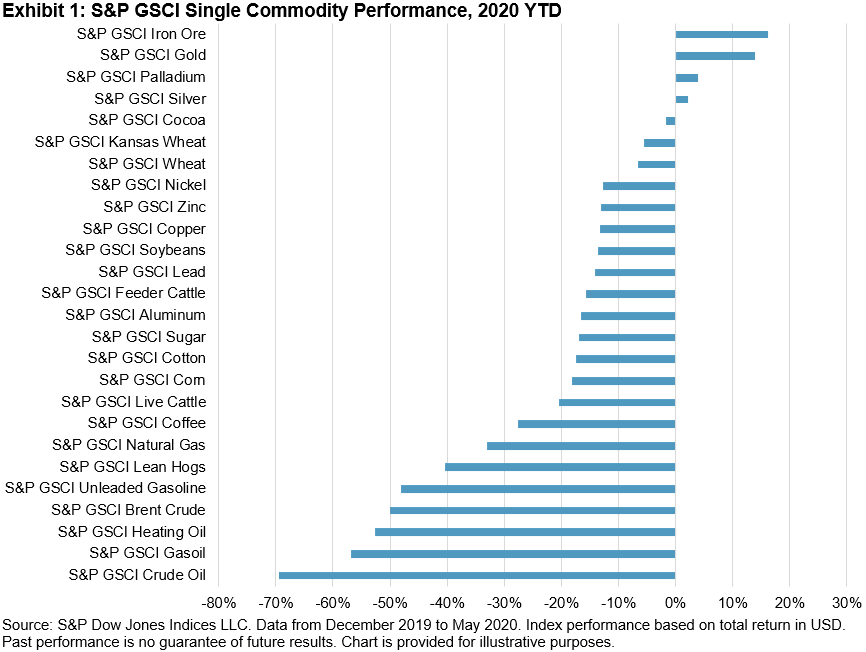
The S&P GSCI Iron Ore was up 22.1% YTD as of June 12, 2020. Launched Nov. 26, 2018, and based on the SGX futures, this index was timely in its creation due to the significant growth in the iron ore market. Similar to gold with its many positive catalysts, iron ore has a lot going for it in 2020. My first blog post from one year ago highlighted the fundamental reasons behind the strong iron ore price at the time. In its first full year of life as an index, the S&P GSCI Iron Ore rose 82% in 2019, hitting several new highs. It set a new all-time high in 2020 one month ago on May 18.

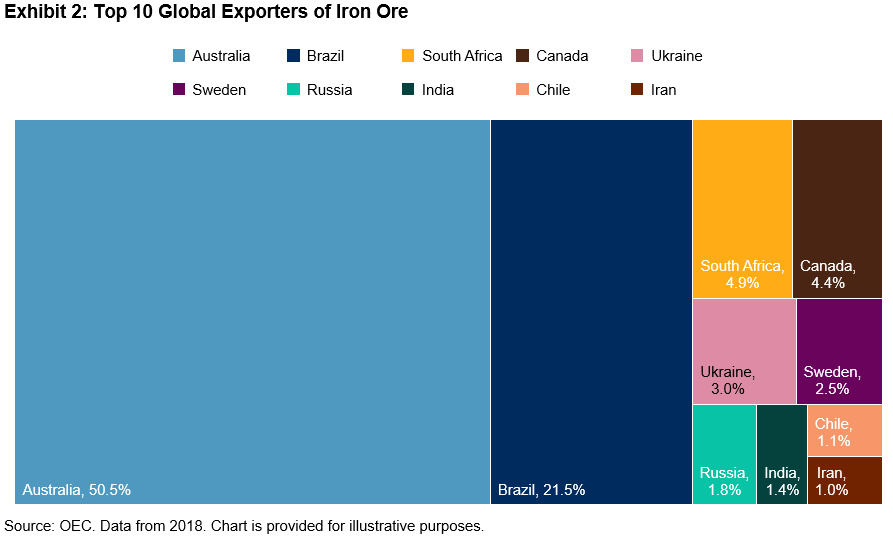
This year, another issue has cropped up to affect the supply picture—market concerns in the form of Brazilian mine shutdowns due to COVID-19. Brazil is the second-largest exporter of iron ore behind Australia (see Exhibit 2). China is the top importer, and no other country comes close to its 62% global share. New COVID-19 cases in Brazil are still escalating, making it a hot spot for the pandemic. This may also affect other major commodities’ production, such as soybeans, of which Brazil is the top exporter.

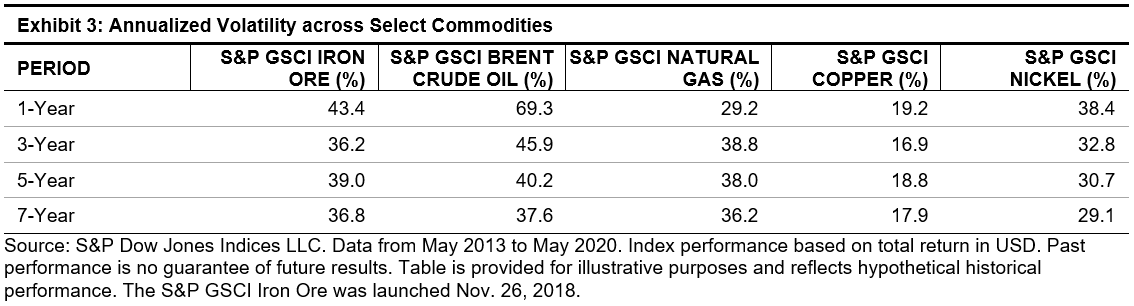
For such a historically volatile commodity, this year iron ore has displayed less volatility than Brent crude and all other major energy commodities, yet it was more volatile than other industrial type metals. While launched Nov. 26, 2018, the S&P GSCI Iron Ore has a first value date of May 7, 2013, giving us seven years of back-tested performance. Exhibit 3 highlights the volatility of the S&P GSCI Iron Ore and other select commodities.

For a more in-depth look at the financialization of the iron ore market, check out the recent collaborative paper from S&P Global Platts and S&P Dow Jones Indices here. Single commodities, whether iron ore, gold, or soybeans, can be useful to investors looking to express investment themes that are dependent on unique geopolitical, demographic, structural, climate, and even health and disease factors.


The posts on this blog are opinions, not advice. Please read our Disclaimers.

Introducing the Dow Jones Equity All REIT Capped Index

Contributor Image
Rachel Du

Senior Analyst, Global Research & Design

S&P Dow Jones Indices

On April 13, 2020, the Dow Jones REIT Index Series welcomed a new index—the Dow Jones Equity All REIT Capped Index. The strategy is a subindex of the Dow Jones Equity All REIT Index, which was launched in January 1997. Although both indices were designed to measure the performance of all publicly traded REITs, the newly launched Dow Jones Equity All REIT Capped Index has some unique features.

The Dow Jones Equity All REIT Capped Index seeks to represent the largest and most liquid REITs. To be eligible for inclusion in the index, a REIT company must have a minimum float market capitalization (FMC) of USD 200 million. An existing constituent becomes ineligible if its FMC falls below USD 100 million for two consecutive quarters. In addition, all index constituents must have a median daily value traded (MDVT) of at least USD 5 million over the prior three months. The MDVT for any existing constituents is USD 2.5 million.

The additional market cap and liquidity criteria can potentially improve the tradability of the index. Exhibit 1 and 2 compare the FMC and MDVT[1] between the Dow Jones Equity All REIT Index and the Dow Jones Equity All REIT Capped Index. Over the past five years, the size and liquidity of the Dow Jones Equity All REIT Capped Index were higher by about 30% over its benchmark index.

The multiple capping rules historically helped the Dow Jones Equity All REIT Capped Index reduce concentration and improve diversification. At each rebalancing, the weight of an index member is capped at 10%, and all constituents that have a weight greater than 4.5% in aggregate are limited at 22.5% of the index. Exhibit 3 shows the weight comparison as of May 29, 2020. The total weight of all constituents with a weight above 4.5% in the Dow Jones Equity All REIT Capped Index is 8.29% less than that of the uncapped version.

With improved tradability and diversification, the index has had a comparable performance with the Dow Jones Equity All REIT Index. Exhibit 4 illustrates that the performance of the Dow Jones Equity All REIT Capped Index is not compromised by the additional rules for size, liquidity, and diversification. While the index outperformed over the short term (one- and three-year periods), both indices had similar absolute and risk-adjusted returns over the long term (since the Dow Jones Equity All REIT Capped Index’s inception date of March 19, 2010).

[1] The FMC and MDTV data is calculated as follows: At each quarterly rebalancing, the median values of the FMC and MDTV are calculated. The average of the median values for each year are used for comparison.

The posts on this blog are opinions, not advice. Please read our Disclaimers.

2020 – The Dawn of the Passive Investing Era in India: Part One

Contributor Image
Koel Ghosh

Former Head of South Asia

S&P Dow Jones Indices

The year 2020 has brought about many unexpected turns of events. The COVID-19 pandemic, which will be marked in history as one of the most-acute pandemics that the world has had to experience, is one.

Another area that has seen a transformation in the financial investing space is the realization and acceptance of passive investing. The recent growth trends globally and in India are marking new trajectories. The global growth story in passive products has been strong and broadening, with new innovations and themes. India has played catch-up, with the exponential growth in assets in the past few years revealing the potential for the passive space in the region.

As of March 2020, global assets in passive products passed USD 5 trillion, with over 7,000 passive products. The U.S., with a market share of 68%, USD 3.6 trillion in assets, and over 2,000 products, is followed by Europe and Japan with 16% and 6.5% of market share, respectively. The global asset mix is skewed toward equities, leading with a 70% share in assets at USD 3 trillion, followed by fixed income with a 21% share at USD 1 trillion.

For India, though the numbers are far more modest, the growth has been encouraging, with the total assets under management in passive products at USD 24 billion and 86 passive products. Five years ago, the scenario in India included a mere USD 2 billion in assets and 57 products. A decade back had far less, with USD 1 billion and 26 products in the market. Hence, the progress made by the country has been remarkable, especially in the backdrop of a faster-paced active investing market. Two years ago, the exchange-traded fund market constituted 2.2% of the mutual fund industry, while in December 2019, it stood at 7.5%.[1]

Global themes in passive products have progressed from plain vanilla asset classes, geographies, segments, and market benchmarks to factors that could be single or multi-factor, thematic-like infrastructure or corporate clusters, sustainability (a popular and fast-growing segment), and so on. Furthermore, advanced concepts are being explored via indices, such as new economies. For example, the S&P Kensho New Economies Indices are a family of indices tracking the industries and innovations of the Fourth Industrial Revolution.

Rapid developments in artificial intelligence and robotics, coupled with exponential processing power and ubiquitous connectivity, are driving structural changes in the global economy, disrupting existing industries and forging new ones. The S&P Kensho New Economies Composite Index is designed to measure the performance of companies involved in the New Economies 21st Century Sectors, including a dynamically adjusted list of companies drawn from all of the S&P Kensho New Economy subsector indices. The S&P Kensho New Economies Select Index measures a subset of the five best-performing subsector indices.

These new innovative indices are breaking grounds in investment themes and products that offer further variety to portfolio strategies.

[1] Source: https://etfgi.com. March 2020.

The posts on this blog are opinions, not advice. Please read our Disclaimers.

Active Managers: No Place to Hide

Contributor Image
Berlinda Liu

Former Director, Multi-Asset Indices

S&P Dow Jones Indices

In the first quarter of 2020, the global economy experienced not a slowdown, but a shutdown. As COVID-19 swept the world, outsized market movements became the new norm. The S&P 500® finished its worst quarter (-19.6%) since 2008’s global financial crisis. International equities fared even worse as the S&P International 700 lost 22.4%. While investors were catching their breath after the February-March sell-off, the S&P 500 rebounded in April and posted its largest monthly gain (12.8%) since 1987.

Active managers sometimes seek to soften the conclusions of our regular SPIVA® reports by arguing that, while index funds may have the advantage in rising markets, it’s in volatile downturns that active management can prove its worth. Historical data argue otherwise,[1] and most active managers continued to underperform in 2020.

Of domestic equity funds, 64% underperformed the S&P Composite 1500® in the first four months of 2020, and 67% underperformed in the past two quarters. During the one-year period ending March 2020, 72% of domestic equity funds underperformed, slightly worse than the year-end 2019 result (70%).

Most large-cap funds underperformed the S&P 500 across all time horizons. The consistency of their underperformance in the first quarter market decline and the April rebound was especially noteworthy. During Q1 2020, 54% of all large-cap funds underperformed; in April, the YTD underperformance percentage increased to 59%. We also observed this pattern in other categories, highlighting the difficulty in market timing.

Short-Term Success versus Long-Term Underperformance

Unsurprisingly, SPIVA results are noisier for shorter time horizons. Although we see pockets of relative success for active managers up to three years, over the long term, they still generally lagged their benchmarks.

In the large-cap space, the only bright spot was large-cap growth, where 75% outperformed in the past two quarters. However, short-term success didn’t compensate for previous underperformance. For the past 15 years, 91% lagged the S&P 500 Growth. Mid-cap and small-cap funds were similar: 64% of all mid-cap and 57% of all small-cap funds beat their benchmarks in the past two quarters, aided by the superior performance of larger names. Their short-term success had little impact on their long-term scores though: 82% underperformed over the past 15 years in both categories.

A similar story occurred in international equities and fixed income. Despite the short-term success of global funds and international small-cap funds, most managers lagged their indices across all categories for any periods three years or longer.

Conclusion

Early 2020 results rebut the view that active funds navigate market turmoil better than index-based funds. Even where results are relatively favorable, the data show the difficulty of market timing. Mixed results in the short term did not change active funds’ tendency to underperform indices over the long term.

Learn more during our webinar on June 30, How Has COVID-19 Affected Active vs. Passive Performance?

[1] 65% of domestic equity funds underperformed the S&P Composite 1500 in 2008.

The posts on this blog are opinions, not advice. Please read our Disclaimers.

Looking Under the Hood of S&P 500 Information Technology Performance

Has the IT sector done well because of the quality factor, or is it the other way round? S&P DJI’s Anu Ganti takes a closer look at the relationship between sectors and factors to explore what’s driving IT’s climb over the past 12 months.

Read the blog: https://www.indexologyblog.com/2020/05/27/symbiotic-sentiments/ 

The posts on this blog are opinions, not advice. Please read our Disclaimers.