Get Indexology® Blog updates via email.

In This List

Have Inverse Indices Been Able to Provide the Hedge You Expected?

Distressed in Distressing Times

Playing Defense with Profitability Screening in Australian Small Caps

Variations in REIT Sectors – Time to Go Defensive

Wash Your Hands of Market Timing with Risk Control

Have Inverse Indices Been Able to Provide the Hedge You Expected?

Contributor Image
Tianyin Cheng

Former Senior Director, ESG Indices

S&P Dow Jones Indices

Since March 9, 2020, we have seen equities and bonds fall together. As bonds fail to provide the diversification benefit in the short term, some investors may choose to use inverse exchange-traded funds as short-term trading tools for an explicit hedge.

Inverse strategies typically aim to replicate the daily performance of their underlying indices with a constant multiplicative factor (such as -1, -2, or -3). While the daily rebalancing allows the products to seek to invert the return of their underlying indices on a daily basis, returns for longer periods are a product of the compounded daily inverse returns during the period, and they could deviate significantly from the stated daily objective. Therefore, although such products offer short-term trading tools for explicit purposes, they may not be suitable as long-term holdings for some investors.

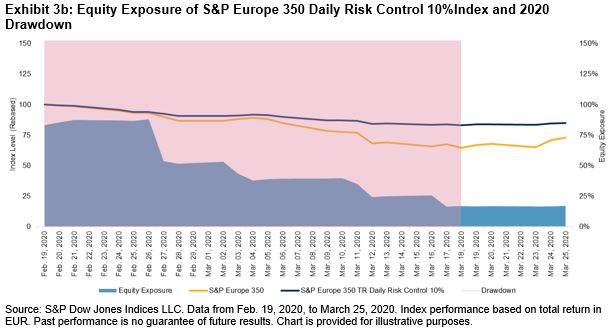
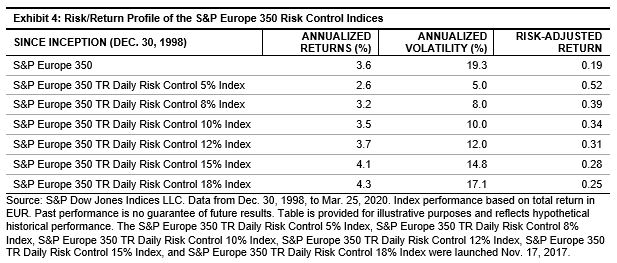
Exhibits 1 and 2 illustrate how inverse daily indices performed in two recent time periods: a period of seven trading days from Feb. 20, 2020, to Feb. 28, 2020, and another period of seven trading days from March 10, 2020, to March 18, 2020. In both periods, the S&P 500® (TR) dropped close to 13%, while the inverse daily indices’ returns were vastly different.

From Feb. 20, 2020, to Feb. 28, 2020, the S&P 500 was trending down every single trading day. In this case, or when the market was trending in one direction in general, the cumulative performance of the inverse daily indices tended to exceed the invert return of the index during the period.

However, from March 10, 2020, to March 18, 2020, the S&P 500 was trending further downward with huge daily swings (from -12% to 5%). In this case, the pursuit of daily investment targets typically had a negative impact on performance for periods longer than one day. The negative impact could have been larger for inverse indices with higher multiples.

This effect of compounding on the cumulative returns may not be trivial for many retail investors. The S&P Leverage and Inverse Indices aim to provide transparent benchmarks for leverage and inverse products.

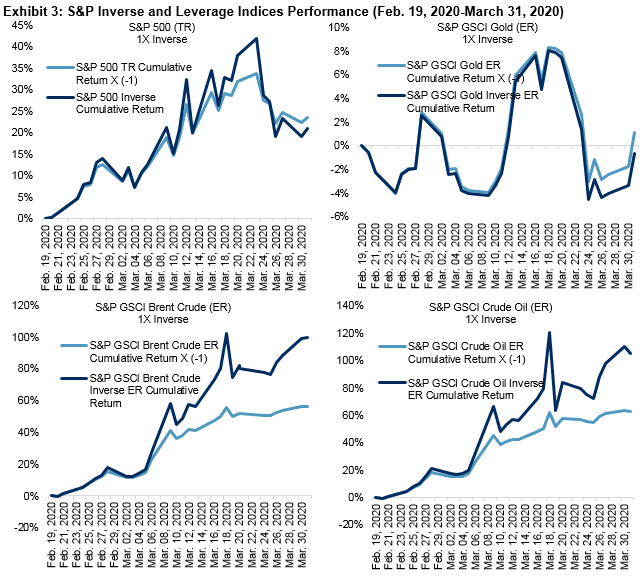
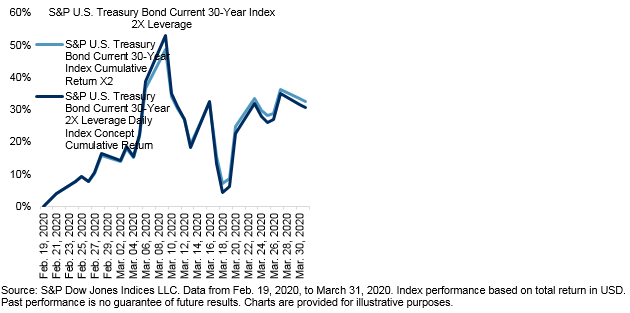
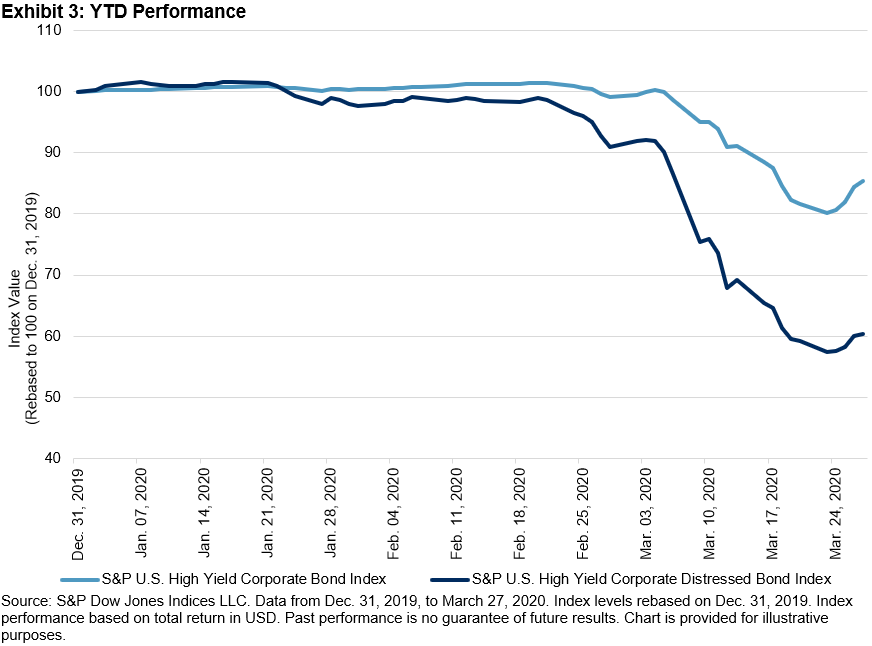
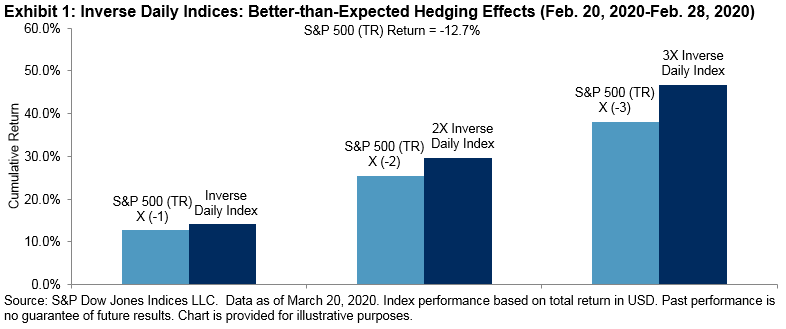
Further details on the S&P Leverage and Inverse Indices are available here: TalkingPoints: S&P Leverage and Inverse Indices. Additionally, the recent performance of key indices is displayed in Exhibit 3 (from Feb. 19, 2020, to March 31, 2020).

The posts on this blog are opinions, not advice. Please read our Disclaimers.

Distressed in Distressing Times

Contributor Image
Kevin Horan

Former Director, Fixed Income Indices

S&P Dow Jones Indices

Jeff Gundlach has been recently quoted as asking, “the Fed can buy up corporate bond ETFs and thereby prop up prices of corporate bonds, but what happens when there are defaults and the artificial Fed price is replaced by the recovery value?”

We have already seen how the S&P U.S. Corporate Investment Grade Corporate Bond Index, an index of 7,000+ bonds whose constituents’ option-adjusted spread (OAS) topped out at 568 at the beginning of March 2020, now contains 99 bonds with an OAS greater than 1,000. Though not all are Energy sector bonds, 51 of the 99 are as the virus and the currently low price of oil take their toll on the economy and energy industry.1

Moving down the credit scale and looking at more speculative-grade securities, the effects are even greater. Year to date, the S&P U.S. High Yield Corporate Bond Index has seen a fair amount of spread widening, as seen in Exhibit 1. In addition to the movement in OAS spreads, the amount of debt per sector that is at or above an OAS of 1,000 (distressed) has also increased since the beginning of the year. Distressed bonds will be an early indicator of issuers that may end up in default.

The S&P U.S. High Yield Corporate Distressed Bond Index is a sub-index of the S&P U.S. High Yield Corporate Bond Index, which focuses on bonds whose OAS are 1,000 or greater. The negative effects of the current market can be seen in its performance as the index is down more than twice as much as its parent index on both a month-to-date and year-to-date basis.

The S&P U.S. High Yield Corporate Distressed Bond Index, when measured on a market-weighted basis, accounts for 3.8% of its benchmark index, though since its first value date on Jan. 31, 2000, it has averaged 9.6% and was as high as 77% on Dec. 31, 2008.

As can be seen in Exhibit 4, the index is going to jump from its current 229 bonds to 963 bonds at the March 31, 2020, rebalancing. This will be the largest number of bonds entering the index at a rebalancing since the Oct. 31, 2008, rebalancing. The percent of distress within high yield will be 30% of market value, or 963 bonds out of the high yield April universe of 2,314 (42%).

As the market scenario plays out after the sudden stop of economic activity due to the COVID-19 pandemic, distressed and defaulted debt will likely continue to be an ongoing concern.

Exhibit 5 breaks down the influx of bonds by industry.

The S&P U.S. High Yield Corporate Distressed Bond Index gives a window into credits that are struggling and the issuers that may eventually end up in default.

S&P Global Ratings said the default rate for high-yield, or junk, bonds is heading to 10% over the next 12 months, more than triple the rate of 3.1% that closed out 2019. 

“The current recession in the U.S. this year is coming at a time when the speculative-grade market is historically vulnerable to a liquidity freeze or an earnings drop,” Nick Kraemer, head of S&P Global Ratings Performance Analytics, said in a statement.


[1] Some Sectors Are Slippery Slopes as Markets Head Downhill

The posts on this blog are opinions, not advice. Please read our Disclaimers.

Playing Defense with Profitability Screening in Australian Small Caps

Contributor Image
Akash Jain

Director, Global Research & Design

S&P BSE Indices

In our research paper titled, Profitability Screening in Australian Small Caps, we examined the effectiveness of a profitability screen on improving return as well as reducing volatility and drawdown for Australian small-cap stocks. Adhering to these principles, the S&P/ASX Small Ordinaries Select Index was launched on Dec. 21, 2018, to track profitable small-cap companies in Australia while minimizing index portfolio turnover and tracking error against the benchmark S&P/ASX Small Ordinaries.

As highlighted in the research paper, the S&P/ASX Small Ordinaries Select Index tended to outperform the benchmark during down and neutral markets (see Exhibit 1). The defensive characteristic of the S&P/ASX Small Ordinaries Select Index was also seen in the recent market downturn. During the period from Dec. 31, 2019, to March 20, 2020, the underlying index fell 30.5%, whereas the select strategy fell by 29.5%, outperforming the benchmark by 100 bps. The outperformance of the S&P/ASX Small Ordinaries Select Index was largely driven by stock selection within sectors (see Exhibit 2). Stock selection in the majority of the sectors attributed positively to the S&P/ASX Small Ordinaries Select Index’s relative performance, where attribution from Health Care and Consumer Discretionary stocks were most pronounced. Nevertheless, the unintended sector bets had marginal negative attribution to the S&P/ASX Small Ordinaries Select Index’s return. The select version of the index carried the highest active sector exposures to Real Estate and Consumer Discretionary, while it was most underweight in Materials and Health Care. The overweight in the Consumer Discretionary sector hurt the S&P/ASX Small Ordinaries Select Index’s performance, but the active sector bets in Consumer Staples and Energy attributed most positively to its return.

In the research paper, we also mentioned the S&P/ASX Small Ordinaries Select Index had a higher profitability active factor exposure than the S&P/ASX Small Ordinaries Index historically. In addition, the S&P/ASX Small Ordinaries Select Index offered higher dividend yields compared with the benchmark, as profitable companies are better positioned to maintain sustainable dividends. Exhibit 3 shows the active factor exposures averaged over the 17-year period since 2002 to 2019. Stock selection based on trailing EPS effectively captured positive profitability exposure for the S&P/ASX Small Ordinaries Select Index every year. As market conditions changed, so did the profitability active factor exposure. We observed in years when the profitability factor exposure was higher, the S&P/ASX Small Ordinaries Select Index tended to have better outperformance, indicating profitability was a determinant factor in driving outperformance of the select index (see Exhibit 4).

1 d’Assier, Olivier. “When Size Matters.” Axioma. Pp 12.

The posts on this blog are opinions, not advice. Please read our Disclaimers.

Variations in REIT Sectors – Time to Go Defensive

Contributor Image
Qing Li

Director, Global Research & Design

S&P Dow Jones Indices

As of March 20, 2020, COVID-19 has disrupted the global economy, resulting in a 32% drawdown in the S&P 500® (total return) from its all-time high. The Dow Jones U.S. Select REIT Total Return Index, which is traditionally more defensive, also plummeted 42% from its peak.

However, the responses within sectors of equity REIT have varied. Our previous research concluded that underlying property types in REIT sectors lead them to react to market conditions differently.1 Exhibit 1 illustrates the most (left) to the least (right) affected sectors within REITs.

Cyclical sectors such as hotels and malls took the brunt of the impact due to their direct dependence on consumer spending. The substantially weakened demand for travel, dining out, lodging, and shopping resulted in hotel and retail REITs suffering more than a 50% loss MTD through March 20, 2020, compared with -21.9% and -33.5% from the S&P 500 and Dow Jones U.S. Select REIT Index, respectively (see Exhibit 2). Health Care REITs, which focus on investing in medical offices and senior housing, declined 44.7% MTD. Increased visits to hospitals made medical buildings less affected compared with senior housing, which took a harder hit because of residents being from a high-risk demographic and delaying moving in to the senior community. This outbreak also pushed more companies to adopt a work-from-home policy, causing reduced demand for office spaces, which led to a 34.5% sell-off in office REITs MTD.

On the other hand, the more stable demand for defensive sectors like data centers and cell towers ensured a relatively milder sell-off. Working from home has increased demand for internet stability, data storage, and mobile usage, thus benefiting the data center and cell tower components of REITs. Showing greater resilience, these two sectors returned -8.8% and -12.9% from March 2, 2020, to March 20, 2020, respectively. Thanks to the rapid growth of e-commerce due to online shopping, industrial REITs outperformed the market by 4.1%. Self-storage REITs also benefited from the rising demand resulting from the sudden country-wide college closures. The self-storage sector held relatively better at a -20.7% return, outperforming overall REITs and equity markets.

Equity REITs as a whole have faced challenges caused by the COVID-19 pandemic; however, REIT sectors reacted differently in response to evolving economic conditions. Hotels and retails REITs have been more affected, while data center, cell tower, and industrial REITs have experienced limited disruptions. REITs of different property types offer varying levels of risk exposure, and investing in defensive REIT sectors can potentially provide shelter in these unprecedented times.

1   Understanding REIT Sectors, January 2020, Q. Li and M. Orzano.

The posts on this blog are opinions, not advice. Please read our Disclaimers.

Wash Your Hands of Market Timing with Risk Control

Contributor Image
Andrew Innes

Head of Global Research & Design

S&P Dow Jones Indices

The market highs of February 2020 already seem like a strange, distant past, in which people socialized, worked in offices, and were blissfully unappreciative of their abundant supply of toilet paper.

Life has changed. With that change, the S&P Europe 350® lost a third of its market capitalization in just a month. The market may have subsequently ticked up, but with volatility still high, it may be premature to call the bottom.

In times of market panic, it is not uncommon for defensive equity factor strategies to correlate with the market. They are, after all, still equity indices. However, the S&P DJI Risk Control Indices, which use realized market volatility to allocate systematically between an equity index and cash, were better able to cushion the crash.

Exhibit 1 shows several risk control indices based on the S&P Europe 350. Each index targets a specific level of annual volatility (e.g., 5%, 8%, 10%, 12%, 15%, or 18%) by reducing its equity allocation when volatility is higher than this target and increasing it when it is lower. Recently, in keeping with current advice, they stayed calm and carried on (from home).

The S&P DJI Risk Control Indices are designed to hold a higher allocation to cash during periods of heightened volatility, and the recent outperformance is typical of the historical record during drawdowns for the benchmark [see Exhibit 2].

Additionally, when volatility is below target, the S&P DJI Risk Control Indices can allocate more than 100% to equities [see Exhibit 3a], so that the indices can occasionally participate more fully in market gains. This combination of drawdown protection and market participation has historically led to better performance for a given level of risk than the S&P Europe 350 over the long term [see Exhibit 4].

The S&P DJI Risk Control Indices provide an alternative, long-term solution that requires no subjective input or activity from the investor. If volatility stays high and markets continue to fall, risk control indices will continue to outperform. Should markets begin their recovery and volatility decline, risk control indices will eventually reallocate back to equities. Additionally, the target volatility mechanism will be there, ready to react again in the future.

Maybe a hands-off approach is what many of us should be looking for after all.

The posts on this blog are opinions, not advice. Please read our Disclaimers.