Get Indexology® Blog updates via email.

In This List

Playing Defense with Profitability Screening in Australian Small Caps

Variations in REIT Sectors – Time to Go Defensive

Wash Your Hands of Market Timing with Risk Control

Rapid Reset

Federal Reserve Becomes Buyer of Last Resort

Playing Defense with Profitability Screening in Australian Small Caps

Contributor Image
Akash Jain

Director, Global Research & Design

S&P BSE Indices

In our research paper titled, Profitability Screening in Australian Small Caps, we examined the effectiveness of a profitability screen on improving return as well as reducing volatility and drawdown for Australian small-cap stocks. Adhering to these principles, the S&P/ASX Small Ordinaries Select Index was launched on Dec. 21, 2018, to track profitable small-cap companies in Australia while minimizing index portfolio turnover and tracking error against the benchmark S&P/ASX Small Ordinaries.

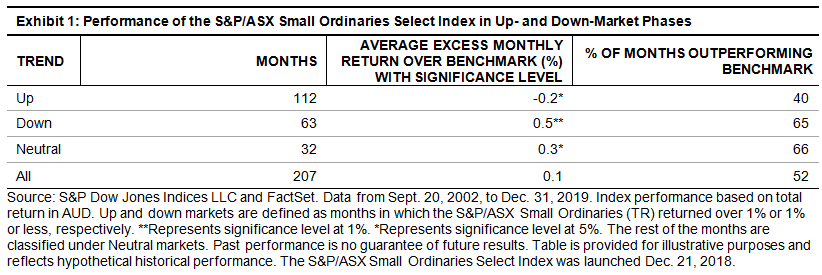
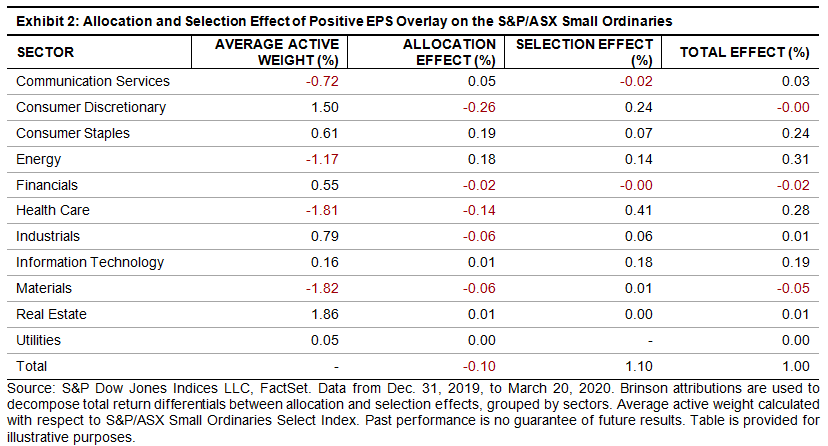
As highlighted in the research paper, the S&P/ASX Small Ordinaries Select Index tended to outperform the benchmark during down and neutral markets (see Exhibit 1). The defensive characteristic of the S&P/ASX Small Ordinaries Select Index was also seen in the recent market downturn. During the period from Dec. 31, 2019, to March 20, 2020, the underlying index fell 30.5%, whereas the select strategy fell by 29.5%, outperforming the benchmark by 100 bps. The outperformance of the S&P/ASX Small Ordinaries Select Index was largely driven by stock selection within sectors (see Exhibit 2). Stock selection in the majority of the sectors attributed positively to the S&P/ASX Small Ordinaries Select Index’s relative performance, where attribution from Health Care and Consumer Discretionary stocks were most pronounced. Nevertheless, the unintended sector bets had marginal negative attribution to the S&P/ASX Small Ordinaries Select Index’s return. The select version of the index carried the highest active sector exposures to Real Estate and Consumer Discretionary, while it was most underweight in Materials and Health Care. The overweight in the Consumer Discretionary sector hurt the S&P/ASX Small Ordinaries Select Index’s performance, but the active sector bets in Consumer Staples and Energy attributed most positively to its return.

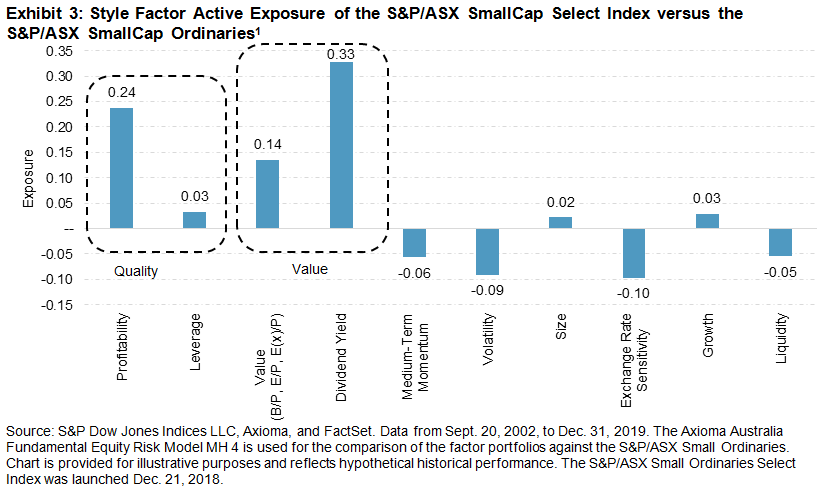
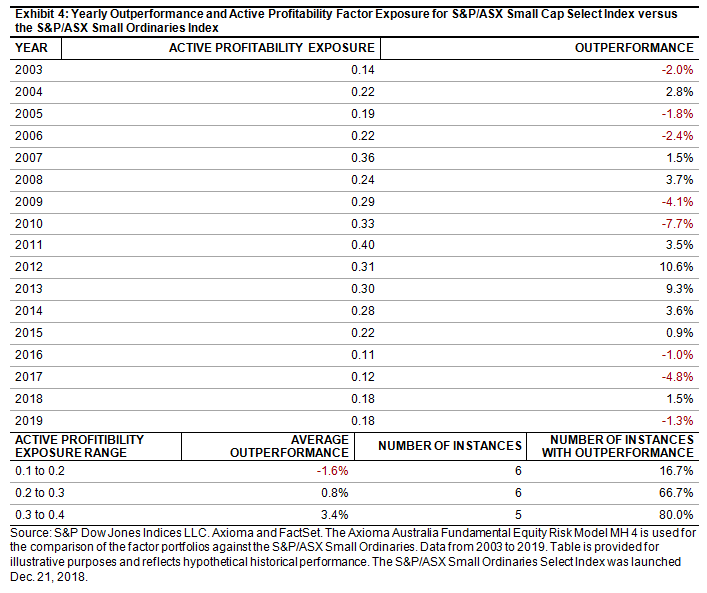
In the research paper, we also mentioned the S&P/ASX Small Ordinaries Select Index had a higher profitability active factor exposure than the S&P/ASX Small Ordinaries Index historically. In addition, the S&P/ASX Small Ordinaries Select Index offered higher dividend yields compared with the benchmark, as profitable companies are better positioned to maintain sustainable dividends. Exhibit 3 shows the active factor exposures averaged over the 17-year period since 2002 to 2019. Stock selection based on trailing EPS effectively captured positive profitability exposure for the S&P/ASX Small Ordinaries Select Index every year. As market conditions changed, so did the profitability active factor exposure. We observed in years when the profitability factor exposure was higher, the S&P/ASX Small Ordinaries Select Index tended to have better outperformance, indicating profitability was a determinant factor in driving outperformance of the select index (see Exhibit 4).

1 d’Assier, Olivier. “When Size Matters.” Axioma. Pp 12.

The posts on this blog are opinions, not advice. Please read our Disclaimers.

Variations in REIT Sectors – Time to Go Defensive

Contributor Image
Qing Li

Director, Global Research & Design

S&P Dow Jones Indices

As of March 20, 2020, COVID-19 has disrupted the global economy, resulting in a 32% drawdown in the S&P 500® (total return) from its all-time high. The Dow Jones U.S. Select REIT Total Return Index, which is traditionally more defensive, also plummeted 42% from its peak.

However, the responses within sectors of equity REIT have varied. Our previous research concluded that underlying property types in REIT sectors lead them to react to market conditions differently.1 Exhibit 1 illustrates the most (left) to the least (right) affected sectors within REITs.

Cyclical sectors such as hotels and malls took the brunt of the impact due to their direct dependence on consumer spending. The substantially weakened demand for travel, dining out, lodging, and shopping resulted in hotel and retail REITs suffering more than a 50% loss MTD through March 20, 2020, compared with -21.9% and -33.5% from the S&P 500 and Dow Jones U.S. Select REIT Index, respectively (see Exhibit 2). Health Care REITs, which focus on investing in medical offices and senior housing, declined 44.7% MTD. Increased visits to hospitals made medical buildings less affected compared with senior housing, which took a harder hit because of residents being from a high-risk demographic and delaying moving in to the senior community. This outbreak also pushed more companies to adopt a work-from-home policy, causing reduced demand for office spaces, which led to a 34.5% sell-off in office REITs MTD.

On the other hand, the more stable demand for defensive sectors like data centers and cell towers ensured a relatively milder sell-off. Working from home has increased demand for internet stability, data storage, and mobile usage, thus benefiting the data center and cell tower components of REITs. Showing greater resilience, these two sectors returned -8.8% and -12.9% from March 2, 2020, to March 20, 2020, respectively. Thanks to the rapid growth of e-commerce due to online shopping, industrial REITs outperformed the market by 4.1%. Self-storage REITs also benefited from the rising demand resulting from the sudden country-wide college closures. The self-storage sector held relatively better at a -20.7% return, outperforming overall REITs and equity markets.

Equity REITs as a whole have faced challenges caused by the COVID-19 pandemic; however, REIT sectors reacted differently in response to evolving economic conditions. Hotels and retails REITs have been more affected, while data center, cell tower, and industrial REITs have experienced limited disruptions. REITs of different property types offer varying levels of risk exposure, and investing in defensive REIT sectors can potentially provide shelter in these unprecedented times.

1   Understanding REIT Sectors, January 2020, Q. Li and M. Orzano.

The posts on this blog are opinions, not advice. Please read our Disclaimers.

Wash Your Hands of Market Timing with Risk Control

Contributor Image
Andrew Innes

Head of Global Research & Design

S&P Dow Jones Indices

The market highs of February 2020 already seem like a strange, distant past, in which people socialized, worked in offices, and were blissfully unappreciative of their abundant supply of toilet paper.

Life has changed. With that change, the S&P Europe 350® lost a third of its market capitalization in just a month. The market may have subsequently ticked up, but with volatility still high, it may be premature to call the bottom.

In times of market panic, it is not uncommon for defensive equity factor strategies to correlate with the market. They are, after all, still equity indices. However, the S&P DJI Risk Control Indices, which use realized market volatility to allocate systematically between an equity index and cash, were better able to cushion the crash.

Exhibit 1 shows several risk control indices based on the S&P Europe 350. Each index targets a specific level of annual volatility (e.g., 5%, 8%, 10%, 12%, 15%, or 18%) by reducing its equity allocation when volatility is higher than this target and increasing it when it is lower. Recently, in keeping with current advice, they stayed calm and carried on (from home).

The S&P DJI Risk Control Indices are designed to hold a higher allocation to cash during periods of heightened volatility, and the recent outperformance is typical of the historical record during drawdowns for the benchmark [see Exhibit 2].

Additionally, when volatility is below target, the S&P DJI Risk Control Indices can allocate more than 100% to equities [see Exhibit 3a], so that the indices can occasionally participate more fully in market gains. This combination of drawdown protection and market participation has historically led to better performance for a given level of risk than the S&P Europe 350 over the long term [see Exhibit 4].

The S&P DJI Risk Control Indices provide an alternative, long-term solution that requires no subjective input or activity from the investor. If volatility stays high and markets continue to fall, risk control indices will continue to outperform. Should markets begin their recovery and volatility decline, risk control indices will eventually reallocate back to equities. Additionally, the target volatility mechanism will be there, ready to react again in the future.

Maybe a hands-off approach is what many of us should be looking for after all.

The posts on this blog are opinions, not advice. Please read our Disclaimers.

Rapid Reset

Contributor Image
Jim Wiederhold

Former Director, Commodities and Real Assets

S&P Dow Jones Indices

Over the past decade, we witnessed the longest economic expansion in history. During that time, risk appetite spiked, elevated largely by deflated interest rates around the globe in the wake of the Global Financial Crisis, as accommodative monetary policy lifted many investors up the risk curve. As in previous crisis periods, elevated risk asset valuations could not hold; today, those levels face the sobering reality of a global pandemic, which has driven global equities into a bear market and threatens to cause a global recession. This drop was different than others before it, however, as it took only a month for stock prices to fall from all-time highs to a deep trough, making it the fastest decline into bear market territory for many major equity benchmarks in history. Investors are now struggling through a rapid reset, looking for the bottom while curtailing their risk appetite.

Though some market pundits repeatedly predicted the collapse of the stock market over the past decade only to be proven wrong time and again with each new market high, during the 2010s, we witnessed one of the least-volatile eras in modern financial markets.

There was one asset class that remained volatile during the past 10 years, however. Commodity market volatility has nearly always been more elevated than that of equities markets, and for good reason: commodities are not anticipatory assets, and spot prices largely reflect the current physical supply and demand dynamics of each underlying commodity. Exhibit 1 highlights that difference in volatility; of particular note is the volatility over the longer term, where the S&P GSCI and S&P GSCI Gold were clearly more volatile than equities or fixed income.

So far in 2020, volatility has spiked across nearly all asset classes. If this holds, these levels would be at least double anything we’ve seen over the past 10 years. While volatility for commodities has jumped this year, due to movements in the oil market, U.S. equity and real asset volatilities ticked up even more in the panic.

Though there has already been a seismic shift in broader risk sentiment across all asset classes, within the commodities market, we may see additional risk re-evaluation. In general, there has been a supply glut across the board for many years, which has depressed price levels. While the primary focus since the start of the COVID-19 pandemic has been on the scale and longevity of demand destruction, supply disruptions will increasingly become a factor in price discovery. Companies involved in the production of commodities are pulling back in response to government-enforced shutdowns and collapsing prices. This is most apparent in the U.S. energy space, where cutbacks in new projects will start to affect oil supply by the end of 2020. The S&P GSCI Petroleum is down a staggering 58.3% YTD, reflecting these depressed price levels, and it is not yet pricing in a supply shortfall. Forced shutdowns are not only affecting the energy sector but metals and mining companies as well. While current stockpiles may meet immediate demand in the short run, once global supply chains start moving again, there will likely be a short- to medium-term drag on supply while firms in many commodities markets restart their operations.

Are we finally at a moment of peak commodities supply? It is impossible to say for certain in the face of an unpredictable pandemic and unprecedented monetary and fiscal stimulus. However, global commodities supply has and will likely continue to fall in the near term, and as levels of economic activity start to pick up, supply will play an increasingly important role in the price discovery process.

The posts on this blog are opinions, not advice. Please read our Disclaimers.

Federal Reserve Becomes Buyer of Last Resort

Contributor Image
Jason Giordano

Director, Fixed Income, Product Management

S&P Dow Jones Indices

In a previous blog, we discussed the U.S. Federal Reserve’s initial responses to the current market volatility and resultant dislocations. In short, dropping rates to 0% and adding over USD 1 trillion to the funding markets did little to abate the severity of the situation. In an effort to prevent a liquidity crisis from turning into a solvency crisis, the Federal Open Market Committee (FOMC), in combination with the Department of Treasury, has rolled out the following measures.

  1. Quantitative Easing (QE): QE is back and bigger than ever: The FOMC will purchase at least USD 500 billion of Treasury securities and at least USD 200 billion of mortgage-backed securities.

There’s no telling exactly what this amount could climb to, given that the objective is to purchase “amounts needed to support smooth market functioning and effective transmission of monetary policy to broader financial conditions and the economy.”1 Exhibit 1 shows the securities held on the Fed’s balance sheet since 2008 through prior QE phases and the 17-month period of quantitative tightening that began in 2017. The red line shows the rapid expansion taking place the week of March 23.

  1. Term Asset-Backed Securities Loan Facility (TALF): USD 10 billion funded by the Department of Treasury.

Another tool from the GFC, the TALF will “enable the issuance of asset-backed securities (ABS) backed by student loans, auto loans, credit card loans, loans guaranteed by the Small Business Administration(SBA), and certain other assets.”1 Exhibit 2 shows the current composition of the asset-backed securities market and its growth following the GFC.

  1. Expansions to the Money Market Mutual Fund Liquidity Facility (MMLF) and the Commercial Paper Funding Facility (CPFF): In an effort to facilitate the flow of credit to municipalities, the Federal Reserve is expanding the MMLF and the CPFF to include high-quality, tax-exempt issues as eligible securities.

This will have a greater impact on money markets than on municipalities, as state and local governments will most likely require more direct intervention. However, Exhibit 3 shows that the announcement encouraged some price support in the broad municipal bond market.

  1. Establishment of Two New Facilities: In an effort to support credit to large employers, the FOMC established the Primary Market Corporate Credit Facility (PMCCF) for new bond and loan issuance and the Secondary Market Corporate Credit Facility (SMCCF) to provide liquidity for outstanding corporate bonds; each facility will begin with USD 10 billion funded by the Department of the Treasury.

This is, perhaps, the most drastic measure the FOMC is taking in an effort to support funding for large corporations. The PMCCF will allow investment-grade companies access to credit and will provide bridge financing of four years. The SMCCF will purchase corporate bonds in the secondary market issued by investment-grade U.S. companies and U.S.-listed exchange-traded funds whose investment objective is to “provide broad exposure to the market for U.S. investment-grade corporate bonds.”1

The FOMC is prohibited from selecting specific corporate issuers, and they can only purchase bonds with a rating of BBB- or higher. Exhibit 4 shows the current credit profile of the U.S. investment-grade corporate bond market. Of the USD 6.3 trillion of corporate bonds, more than 55% are rated BBB. While both facilities will surely grow in size to support the market need, the greater risk is the further degradation of credit quality of the USD 3.4 trillion of corporate bonds outstanding.

While the measures outlined in this post are intended to provide support to corporate and municipal debt markets, monetary policy (no matter how extreme) may not be enough to prevent further repricing. More than likely, the highly anticipated fiscal response is what will ultimately determine how soon stability returns to financial markets.

  1. Board of Governors of the Federal Reserve System; federalreserve.gov.

The posts on this blog are opinions, not advice. Please read our Disclaimers.