Get Indexology® Blog updates via email.

In This List

S&P Dow Jones Indices Launches First Single-Commodity Carbon Emission Allowances Index

The S&P Eurozone Paris-Aligned Climate Index Concept Sensitivity Analysis: Decarbonization over Time

Women and the S&P Latin America Emerging LargeMidCap ESG Index

The Irrelevance of Value in Low Volatility

Fixed Income in Stressful Times

S&P Dow Jones Indices Launches First Single-Commodity Carbon Emission Allowances Index

Contributor Image
Fiona Boal

Managing Director, Global Head of Equities

S&P Dow Jones Indices

The S&P GSCI Carbon Emission Allowances (EUA) EUR represents an expansion of the single-commodity series of indices based on the S&P GSCI and is the first index of its kind in the market. The S&P GSCI Carbon Emission Allowances (EUA) EUR is designed to provide investors with a reliable and publicly available investment performance benchmark for European Carbon Emission Allowances. The S&P GSCI Carbon Emission Allowances (EUA) EUR is based on the ICE EUA Futures Contract.[1]

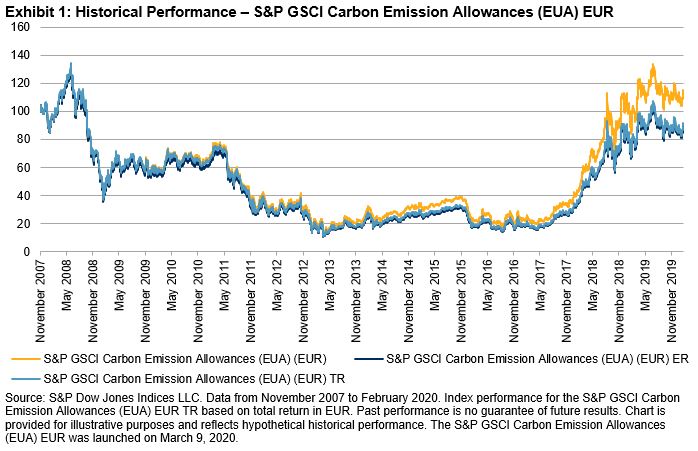
Carbon emissions trading is a market-based method for reducing global greenhouse gases. Carbon trading in the EU was implemented as a result of the Kyoto Protocol—created by the United Nations Framework Convention on Climate Change (UNFCCC), aimed at fighting global warming. The objective was to develop a market that manages worldwide greenhouse gas emissions based on economic and trading principles that are common across commodities markets. This approach allows countries to reduce pollution with a cap and trade system that operates through regulated markets.

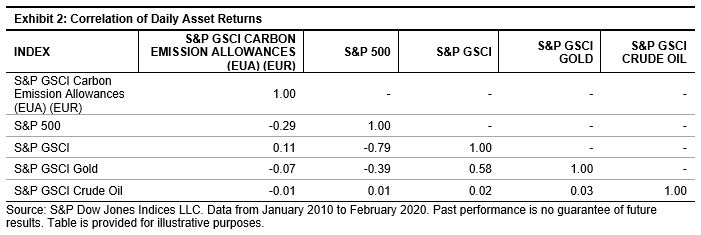
Emissions trading markets have become increasingly robust over recent years, offering a market-based approach to limiting pollution by providing economic incentives for achieving reductions in pollutant emissions. A liquid, transparent market for carbon and a robust price for carbon are critical to facilitating the reduction of greenhouse gas emissions. The S&P GSCI Carbon Emission Allowances (EUA) EUR seeks to offer access to the return stream of a unique asset that is uncorrelated to major commodities and other asset classes and, at the same time, may promote a transition to a lower carbon economy.

Investors may choose to utilize the carbon emissions trading market to express specific views on the price of carbon, to hedge or offset more carbon-heavy investments in their portfolio or combine carbon emissions with other assets to create energy-transition or low-carbon strategies.

There may also be opportunities for participants in the physical carbon emissions market to utilize financial products based on the S&P GSCI Carbon Emission Allowances (EUA) EUR in conjunction with other risk management instruments. Broadening the number of financial instruments available to hedgers in the global carbon market is an important goal of the S&P GSCI Carbon Emission Allowances (EUA) EUR.

[1] https://www.theice.com/products/197/EUA-Futures

The posts on this blog are opinions, not advice. Please read our Disclaimers.

The S&P Eurozone Paris-Aligned Climate Index Concept Sensitivity Analysis: Decarbonization over Time

Contributor Image
Ben Leale-Green

Former Associate Director, Research & Design, ESG Indices

S&P Dow Jones Indices

To meet the proposals for CTBs or PABs,[1]—as published by the EU Technical Expert Group (TEG) in its Final Report,[2] —active share[3] and therefore tracking error are uncertain over time,[4] due to the TEG’s absolute decarbonization proposal.[5] This blog assesses the S&P Eurozone Paris-Aligned Climate Index Concept’s (PAC Concept) potential active share sensitivity to future decarbonization, to align with a 1.5 °C scenario.[6] Exhibit 1 shows future PAB and CTB trajectories and possible parent index trajectories from 7% decarbonization and 3% carbonization. If in twenty years the parent index carbonizes at 3% year-on-year, a 90% relative carbon reduction will be required for the PAB (hopefully far higher than will be observed).

In January, S&P Dow Jones Indices released a paper for the PAC Concept—designed not only to meet the TEG’s proposals for PABs but incorporate transition risk, physical risk, and climate opportunities, as recommended by the TCFD7 (see Exhibit 2).

Baskets have been calculated using the methodology outlined,[8] with 50%-90%[9] decarbonization constraints. The aim is understanding how potential future relative carbon reductions, due to 7% year-on-year decarbonization, will affect diversification and active share of the PAC Concept.[10] The PAC Concept active share sensitivity analysis has been calculated with all other constraints held constant.[11]

Exhibit 3 shows the stock count and effective number of stocks[12] at each level of decarbonization. As decarbonization increases, the number of stocks decrease—this decrease in stock count is gradual until 90% decarbonization, which would be an extreme level of decarbonization. Furthermore, as stock count decreases, the effective number of stocks decreases at a slower rate—meaning the PAC Concept methodology allows concentration to increase at a slower rate than stock count decreases. Even at 90% decarbonization, which is very high, there is still reasonable diversification within the PAC Concept.

Exhibit 4 shows the sensitivity of active share as decarbonization increases. We can see a similar story as in Exhibit 3, where decarbonization up until 70% has a small impact on active share, and only when 90% decarbonization is targeted does active share jump.

Why is there a non-linear relationship between decarbonization and active share/effective number of stocks/stock count? Exhibit 5 shows the carbon intensity distribution for companies in the S&P Eurozone LargeMidCap, which have a heavy positive skew. This skew means decarbonization until a certain point does not require much active share. As decarbonization requirements increase, it takes more active share to meet the decarbonization constraint. When more significant weight can be taken out of high-emitting companies, this causes a large impact on the PAC Concept’s carbon footprint. However, as carbon reduction requirements grow, there is little or no weight to be taken from these highest-emitting companies, so weight must be taken from less carbon-intensive companies. This weight reduction in less carbon-intensive companies has a lower impact on the carbon footprint.

Overall, the PAC Concept appears to be able to decarbonize by an amount that is in line with a worst likely scenario, without causing drastically poorer diversification.

1 Regulation (EU) 2019/2089 has created two new categories of benchmark; Regulation (EU) 2019/2089 has created two new categories of benchmark; and the EU Climate-Transition Benchmark.

2 The EU Technical Expert Group on Sustainable Finance Final Report on Climate Benchmarks and Benchmarks’ ESG Disclosure, September 2019.

3 Active share measures how much of the parent index would have to be sold to invest in the PAC concept. ; where w is the weight of stock i.

4 Leale-Green, B. (2019, November). The EU Climate Transition and Paris-Aligned Benchmarks: A New Paradigm. Retrieved from Indexology Blog: https://www.indexologyblog.com/2019/11/07/the-euclimate-transition-and-paris-aligned-benchmarks-a-new-paradigm/

5 The final report published by the TEG proposes that CTBs and PABs decarbonize at 7% year-on-year, regardless of the parent index’s decarbonization. This means at any point in time, the relative carbon intensity reduction from the parent index is uncertain.

6 IPCC, 2018: Global warming of 1.5°C. An IPCC Special Report on the impacts of global warming of 1.5°C above pre-industrial levels and related global greenhouse gas emissions pathways, in the context of strengthening the global response to the threat of climate change, sustainable development, and efforts to eradicate poverty [V. Masson-Delmotte, P. Zhai, H. O. Pörtner, D. Roberts, J. Skea, P.R. Shukla, A. Pirani, W. Moufouma-Okia, C. Péan, R. Pidcock, S. Connors, J. B. R. Matthews, Y. Chen, X. Zhou, M. I. Gomis, E. Lonnoy, T. Maycock, M. Tignor, T. Waterfield (eds.)]. In Press.

7 TCFD. (2017). Final Report: Recommendations of the Taskforce on Climate Related Financial Disclosures.

8 Leale-Green, B., & Cabrer, L. (2020). Conceptualizing a Paris-Aligned Climate Index for the Eurozone. S&P Dow Jones Indices. Retrieved from https://spindices.com/documents/research/research-conceptualizing-a-paris-aligned-climate-index-for-the-eurozone.pdf

9 Analysis was performed on the S&P Eurozone LargeMidCap universe for a hypothetical rebalance in November 2019.

10 All other data has been held constant; in the future, other datasets in the PAC Concept will change, as will the parent index constituents and weights. Therefore, more or less active share may be required to hit the same levels of decarbonization in the future.

11 The constraints aim to meet the proposal for PABs and introduce transition risk, physical risk, and climate opportunities, as laid out by the TCFD.

12 The effective number of stocks (EN) is a measure of index concentration.  EN is calculated as: ; where w is the weight of stock i. The lower the value for EN, the more concentrated the index. The value for EN will fall between 1 and the number of stocks in the index (if the stocks are equally weighted).

The posts on this blog are opinions, not advice. Please read our Disclaimers.

Women and the S&P Latin America Emerging LargeMidCap ESG Index

Contributor Image
Maria Sanchez

Director, Sustainability Index Product Management, U.S. Equity Indices

S&P Dow Jones Indices

An opportunity is knocking at the door of companies in Latin America. S&P Global published the Corporate Sustainability Assessment (CSA) Latin America Progress Report 2019, which revealed that, on average, Latin American companies only have one female director on their board of directors.

Reviewing the 125 constituents of the S&P Latin America LargeMidCap as of Dec. 31, 2019, we obtained similar findings.

A recent study, When Women Lead, Firms Win, conducted by Daniel J. Sandberg, showed that firms with a high level of gender diversity on their board of directors have been more profitable than companies with a low level of gender diversity.

This result supports the inclusion of gender diversity as a relevant and important metric in CSA, an annual evaluation of companies’ sustainability practices in different dimensions. Gender diversity is evaluated through the Corporate Governance and Labor Practice Indicators outlined in the CSA.

S&P Dow Jones Indices uses S&P Global’s information to generate the S&P DJI ESG Scores, which focus on the most financially material and relevant ESG signals within specific industries. With these scores, S&P Dow Jones Indices designed the S&P ESG Index Series. This global series of indices provides improved ESG representation while offering a overall industry group weights similar to that of the respective benchmark.

One of the potential benefits of ESG indices is to have greater exposure to companies with above-average female representation on their board of directors. We found that the S&P Latin America Emerging LargeMidCap ESG Index has 18.7% more exposure to companies with at least 15% female representation on their boards, as compared with the S&P Latin America LargeMidCap (see Exhibit 2).

When it comes to the proportion of women holding management positions, the figures are even more striking. Only 5.5% of companies in the S&P Latin America LargeMidCap have more than 50% of management positions held by women. For the S&P Latin America Emerging LargeMidCap ESG Index, this number is 7.8%.

Out of 129[1] Latin American companies assessed through the CSA 2019 that reported their composition, 10.9% companies had more than 50% of women in management positions.

While the S&P Latin America Emerging LargeMidCap ESG Index shows increasing exposure to companies with female representation on their board of directors, the Latin American region has room to improve diversity further and, in doing so, potentially improve profitability.

[1]   53.52% of 241 companies assessed in the CSA 2019.

The posts on this blog are opinions, not advice. Please read our Disclaimers.

The Irrelevance of Value in Low Volatility

Contributor Image
Fei Mei Chan

Former Director, Core Product Management

S&P Dow Jones Indices

Low volatility strategies have achieved considerable market acceptance in the aftermath of the 2008 financial crisis.  For most of the 12 years since then, skeptics have argued that low vol might become, and sometimes that it has become, overvalued.  It’s an understandable concern, especially in light of the continuing popularity of low volatility strategies.

We recently updated our 2016 study of The Valuation of Low Volatility to see what, if any, impact valuations might have on the future performance of the S&P 500 Low Volatility Index®.  Our most important conclusion now, as it was then, is that valuations have little relevance as a leading indicator of Low Vol performance.

The chart below summarizes this point in one picture. It maps the monthly valuation of Low Vol (relative to the S&P 500) against its relative performance in the subsequent month. If it looks scattered, that’s because it is; the correlation between this month’s valuation and next month’s performance is 0.03.  As an indicator of entry and exit points for low volatility strategies, value does not appear to be valuable.

Scatter Plot of Monthly Relative Value Scores and S&P 500 Low Volatility Index Performance Spread in Subsequent Month Depicts No Relationship


The posts on this blog are opinions, not advice. Please read our Disclaimers.

Fixed Income in Stressful Times

Contributor Image
Brian Luke

Senior Director, Head of Commodities, Real & Digital Assets

S&P Dow Jones Indices

For those wondering what role fixed income would have in their portfolio at record-low yields, they had to wait just one week. On Friday, Feb. 21, 2020, we hit a record-low yield for the 30-year Treasury, as the S&P U.S. Treasury Bond Current 30-Year Index yield fell to 1.92%. The next week, the Dow Jones Industrial Average proceeded to shed over 3,500 points and Treasuries maintained their safe haven status. Following an emergency 50 bps rate cut by the Fed, the 10-year set an all-time low, falling below 1% for the first time. The double digit returns in bonds YTD continue to buffer losses in investors’ portfolios.

The continual downward march in yields has created large shifts in the fixed income market structure, affecting investors who benchmark their portfolios to indices. Borrowers, for the most part, have taken advantage of lower rates to issue debt at lower levels, which lowers the potential return for investors. The coupon rates for fixed income indices have fallen 1%-2% over the past decade (see Exhibit 2). Ten years ago, investment-grade issuers were paying an average coupon of around 6%, while that is closer to what high-yield issuers pay today. While coupons have fallen, the interest rate risk has risen, as measured by modified duration. Borrowers have issued longer dated debt, increasing the index average by nearly 30% and 40% for investment grade and Treasury indices, respectively (see Exhibit 3). While interest rate risk has gone up, credit risk, as measured by the average credit rating of investment-grade issuers, has also increased (see Exhibit 4). BBB-rated securities account for 54% of the investment-grade market, up from 21% in 2000.

Futures markets seem to point to higher potential volatility in 2020 as we near the November 2020 general election. VIX® futures price a premium leading into the November 2020 election and current delegate counts show a stark contrast in political policy to challenge the incumbent. With stocks coming off record highs and markets pricing for increased volatility around Election Day, there still appears to be a place for bonds in your portfolio.

Market participants today are living in a stressful environment, which includes rising interest rate risk, credit risk, and volatility risk. The potential diversification benefit of bonds in a portfolio context should be considered.

The posts on this blog are opinions, not advice. Please read our Disclaimers.