Get Indexology® Blog updates via email.

In This List

Outperforming with Systematic Sector Bets Using the S&P 500 Sector Rotator Daily RC2 5% Index

Comparison of Dividend-Focused Strategies in Brazil

A Way of Seeing

Green Bond Issuance: Setting Records

How Australian Dividend Investors Could Benefit from the Core-Satellite Approach

Outperforming with Systematic Sector Bets Using the S&P 500 Sector Rotator Daily RC2 5% Index

Contributor Image
Karina Tjin

Former Analyst, Strategy Indices

S&P Dow Jones Indices

Given the current market conditions, the popularity of strategies that rotate between factors or sectors, providing agility in their allocations with the goal of capturing outperformance in changing economic regimes, has increased considerably. One of these strategies is the S&P 500® Sector Rotator Daily RC2 5% Index. The index rotates between the top three sectors that have the highest relative value and highest short-term momentum. The index also has a risk control overlay with a daily target volatility of 5%.

The sector rotation component of the S&P 500 Sector Rotator Daily RC2 5% Index is crucial to its performance. We can see that, historically, there has been a diverse representation of sectors in the index (see Exhibit 1). The sector allocation rebalances every six months to capture potential changes in the sectors relative to their peers or in the macroeconomic environment. For example, the S&P 500 Sector Rotator Daily RC2 5% Index is currently allocated to Materials, Industrials, and Real Estate—sectors that traditionally outperform in the early to late expansion phases of the business cycle.

With respect to risk control, the S&P 500 Sector Rotator Daily RC2 5% Index uses the S&P 500, the S&P 10-Year U.S. Treasury Note Futures Index, and cash to target a volatility of 5% and protect the index against significant drawdowns. Exhibit 2 shows that the S&P 500 Sector Rotator Daily RC2 5% Index had varying amounts of exposure to equities, bonds, and cash in the studied period from June 2006 to October 2019. From October 2018 to October 2019, the index was allocated to equities and bonds, with the average equity exposure at 37.9% and average bond exposure at 62.1%. This high bond exposure was due to higher volatility in the equities market, which pushed the risk control to move toward less-volatile assets. When both equity and bond volatilities are high, the index allocates to cash, which is what occurred during the recession from 2007 to 2009.

In Exhibit 3, we can see that the index outperformed comparable strategies in terms of annualized and risk-adjusted returns. The S&P 500 Sector Rotator Daily RC2 5% Index demonstrated superior performance in the short and long term relative to the strategies that use either cash only or the S&P U.S. Treasury Bond Current 5-Year Index in terms of risk control. Having the sector rotation component built into the index is significant considering that the S&P 500 Daily Risk Control 5% Index, which does not use sector rotation, underperformed the other indices in our analysis. When compared with indices that use both sector rotation and risk control, such as the S&P 500 Sector Rotator Daily RC2 5% (5Yr Treasury) Index or the S&P 500 Sector Rotator Daily Risk Control 5% Index, we could attribute the higher performance of the S&P 500 Sector Rotator Daily RC2 5% Index to its allocation to the 10-Year Treasury. This could be due to the yield curve volatility in the shorter end of the curve in March 2019 and May 2019 and potential fears of a recession hindering the performance of the 5-Year Treasury.

Overall, the S&P 500 Sector Rotator Daily RC2 5% Index is designed to successfully capture the performance of sectors that achieve higher returns in different phases of the economic cycle and the risk control overlay effectively manages the volatility of the index.

The posts on this blog are opinions, not advice. Please read our Disclaimers.

Comparison of Dividend-Focused Strategies in Brazil

Contributor Image
Maria Sanchez

Director, Sustainability Index Product Management, U.S. Equity Indices

S&P Dow Jones Indices

While dividend-focused strategies are popular across various regions, not all dividend strategies or dividend indices are constructed the same way or have the same objective.

In Brazil, S&P Dow Jones Indices has three different dividend-focused strategies.

  1. The S&P Dividend Aristocrats Brasil Index, designed to measure the performance of 30 stocks in the S&P Brazil BMI that maintain increasing or stable dividends.
  2. The S&P Brazil Dividend Opportunities, designed to measure the performance of 40 of the highest-yielding stocks in the S&P Brazil BMI that demonstrate profitability.
  3. The S&P/B3 Low Volatility High Dividend Index, designed to measure the performance of the least volatile stocks among a specified group of high-dividend-yielding constituents of the S&P Brazil BMI that trade on the B3.

The three strategies are high-yield oriented, which means that constituents’ weights are determined by their 12-month dividend yield, subject to concentration constrains. The main difference is in the eligibility criteria and the member selection, as described in Exhibit 1.

Different mechanics can lead to different risk/return profiles. Over the 5- and 10- year periods, the three strategies were shown to add value compared with their benchmark, and the dividend yield achieved was around double that of the S&P Brazil BMI (see Exhibit 2).

Differences in methodologies also result in varied sector composition. Compared with the S&P Brazil BMI, the dividend strategies had lower exposure to Consumer Staples and higher exposure to Utilities. In contrast with the S&P Dividend Aristocrats Brasil Index and S&P Brazil Dividend Opportunities, the S&P/B3 Low Volatility High Dividend Index had no exposure to Energy and Information Technology, which among dividend payers tend to be relatively more volatile.

The different dividend-focused indices each have specific objectives, such as absolute high yield (in the case of the S&P Brazil Dividend Opportunities), stable, consistent dividend growth (S&P Dividend Aristocrats Brasil Index), or capturing the benefits of high dividend and low volatility strategies (S&P/B3 Low Volatility High Dividend Index). Pick your favorite!

The posts on this blog are opinions, not advice. Please read our Disclaimers.

A Way of Seeing

Contributor Image
Craig Lazzara

Former Managing Director, Index Investment Strategy

S&P Dow Jones Indices

A wise man told me years ago that sometimes the things we see are less important than our way of seeing.  As more formerly-active investors begin to use passive vehicles, it’s useful to consider if there’s a distinctly index-centric way of seeing, and what its elements might be.  I think that there are at least three such elements.

First, passive is the default position.  When considering a market, a segment, a factor — first ask how it can be accessed passively, or “indicized.”  Claims of value added by active stock selection should be viewed with extreme skepticism.  This is not an argument from convenience or doctrine, but rather a reflection of a powerful empirical truth: most active managers underperform most of the time.  Over intervals as short as five years, it’s not uncommon to find that more than 80% of active managers lag a benchmark that’s appropriate to their investment style.  This is not a statistical coincidence; it happens for good reasons and is therefore highly likely to persist for the foreseeable future.  Defaulting to passive simply recognizes this reality.

Second, think of an active portfolio as a collection of attributes, not a collection of stocks.  For any individual company, stock-specific matters typically dominate risk and return.  At the portfolio level, idiosyncratic issues are much less important.  Otherwise said, the important drivers of portfolio success are factor exposures: large cap vs. mid- or small cap, growth vs. value, low volatility vs. high volatility, high quality vs. low quality, and so on.  The names of the stocks matter much less than their collective exposure to these factors.  More often than not, in fact, we find that stock selection actually subtracts value, even from successful active portfolios.

Finally, view performance as a byproduct, not as an end in itself.  This is perhaps the most difficult adjustment required in the active mindset; obviously investors put money in the stock market because they expect it to generate better performance than bonds or cash.  So it has done over the long run, but agnosticism is generally in order when it comes to short-run results.  This is particularly true for factor indices, which enable investors to indicize active strategies.  Just as no active manager outperforms all the time, neither does any factor.  For example, low volatility indices, over time, have outperformed quite handsomely — but that is not the measure of their success.  Their success is judged by their having mitigated the fluctuations in their parent indices – which, in rising markets, can lead to lagging results.  In cases such as this, underperformance is not an indication of failure.  It may simply mean that a factor index is doing what it was designed to do.

These three precepts — defaulting to passive, approaching portfolios as attributes, and viewing performance as a byproduct — go a long way to defining an index investor’s view of the world.

The posts on this blog are opinions, not advice. Please read our Disclaimers.

Green Bond Issuance: Setting Records

Contributor Image
Kevin Horan

Former Director, Fixed Income Indices

S&P Dow Jones Indices

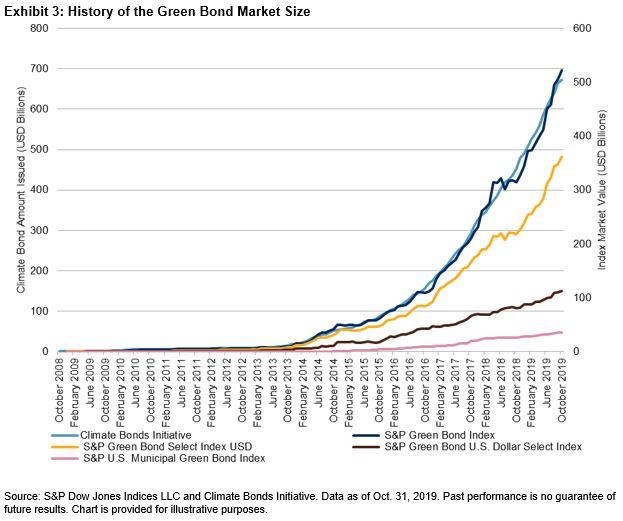
In June 2019, Reuters published that green bond issuance for the year had surpassed USD 100 billion,[1] which extolled a milestone of the first time the green bond issuance pace had reached the USD 100 billion mark by the first half of the year. Issuance could be on track to double by the end of the year. Since the end of June, USD 90 billion more has been issued, bringing the 2019 total to USD 212 billion in issuance as of October 2019.

When looking at country of issuance, the U.S. led national rankings, followed by France, China, Germany, and the Netherlands.

Derived from the same data, though organized for index use, the S&P Green Bond Index contains 5,774 bonds with a market value of USD 546 billion. Originally launched in 2014, the S&P Green Bond Index is a broad market index that is designed to measure the performance of green bonds regardless of size, coupon, or structure. The index and its subindices have grown in size as issuance has continued to increase for the green bond market.

Like the green bond market, the top countries in the S&P Green Bond Index are the U.S., France, and China, which make up 17%, 14%, and 9% of the index’s weight, respectively. The ratings within the index have transitioned from the historic AAA of supranational, which in the past consisted of heavy issuers of green bonds, to its current breakdown, seen in Exhibits 3 & 4.

The makeup of the issuers also shifted from supranational and short duration to longer-dated and larger sovereign and corporate bonds. The weighted average maturity of the S&P Green Bond Index went from 2.5 years in 2012 to 9.5 years in 2019, with a modified duration of 6.5 years.

Exhibit 6 compares the 1-, 3-, 5-, and 10-year returns of the S&P Green Bond Index, of which corporates was around 50% for the index and the market. Since the majority of credits for the index and the overall market were investment grade (80%), Exhibit 4 compares investment-grade corporates in USD terms.

Currently, the green bond market is small when compared to the overall fixed income market. Issuance continues to increase along with the diversity of issuers. The existence of the green bond market and the S&P Green Bond Index is a start, but if capital markets are to meet the needs of the environment and reversing the damages of climate change, the scale of investment capital would have to be exponentially larger in order to meet the challenge.

[1]   Learn more at the following link: https://www.reuters.com/article/us-bonds-environment/green-bond-issuance-surpasses-100-billion-so-far-this-year-data-idUSKCN1TQ11V.

The posts on this blog are opinions, not advice. Please read our Disclaimers.

How Australian Dividend Investors Could Benefit from the Core-Satellite Approach

Contributor Image
Izzy Wang

Senior Analyst, Factors and Dividends

S&P Dow Jones Indices

The core-satellite approach splits a portfolio into two parts: the main part, called the core, and a much smaller portion, called the satellite. The core generally consists of “boring” but steady long-term performance (often index funds tracking market portfolios), while the satellite can be anything that could complement the core with risk diversification, outperformance potential, or both. This way, you could have the benefits of a diversified portfolio, an opportunity to outperform the market, and the advantage of lower management and transaction costs.

For income-seeking investors with core holdings of market portfolios like the S&P 500 and the S&P/ASX 300, the S&P/ASX 300 Shareholder Yield Index and the S&P 500 Low Volatility High Dividend Index can be compelling satellite options for their attractive dividend yield and high active share.[1]

Attractive Dividend Yield

The trailing 12-month dividend yield averaged 5.02% for the S&P/ASX 300 Shareholder Yield Index from its launch in December 2014 to October 2019 (see Exhibit 1). The S&P 500 Low Volatility High Dividend Index also posted an impressive 4.11% average dividend yield from its launch in September 2012 to October 2019.

High Active Share

Since January 2015, the active share of the S&P/ASX 300 Shareholder Yield Index against the S&P/ASX 200 averaged 74%. For the S&P 500 Low Volatility High Dividend Index versus its benchmark, the number was 85%. This means that both indices could be more “active” than many active yield-focused funds offered in Australia and can complement a core index holding in an investor’s portfolio.

Implementing the Core-Satellite Approach with the Two Dividend Indices

If your core is the S&P/ASX 300 or the S&P 500, how would your portfolio look like if you moved some capital to the corresponding dividend index? Exhibits 2 and 3, which depict the risk/return profiles of 11 combinations of core and satellite, provide a visual illustration of the effects.

Over the past 15 years, a 100% S&P 500 portfolio generated 8.9% annual total return, with 12.3% annualized volatility (in AUD; see Exhibit 2). When the allocation moved to the S&P 500 Low Volatility High Dividend Index by 10%, 20%, 30%, etc., the risk/return point moved toward the top left of the original portfolio, which means higher return and lower risk. For example, at the 50/50 allocation, the total return increased 80 bps to 9.7% per year and volatility decreased to 11.8%.

Similarly, moving capital from an S&P/ASX 300 core holding to the S&P/ASX 300 Shareholder Yield Index could also improve portfolio risk/return (see Exhibit 3).

The curves in Exhibits 2 and 3 reveal how diversification improves a portfolio’s risk/return profile, or what is called the “efficiency” of portfolios. It could be used as a guide to help investors implement the core-satellite approach.

[1] Wang, Izzy and Tianyin Cheng, 2019, TalkingPoints: The S&P/ASX 300 Shareholder Yield Index.

The posts on this blog are opinions, not advice. Please read our Disclaimers.