S&P Dow Jones Indices’ recent paper “The S&P MidCap 400®: Outperformance and Potential Applications” shows that mid-cap stocks have often been overlooked in favor of other size ranges in investment practice and in academic literature. This is despite the fact that the S&P MidCap 400 has outperformed the S&P 500® and the S&P SmallCap 600® at an annualized rate of 2.03% and 0.92%, respectively, since December 1994. While the mid-cap index was, on average, roughly 15% more volatile than its large-cap counterpart, its higher returns more than compensated over longer periods.
Market capitalization is the main determinant of size classifications, however there is no universally accepted way to define the mid-cap universe. Some index providers use a fixed-count, ranked approach to determine the mid-cap universe, while others target a proportion of free-float-adjusted market cap coverage instead.
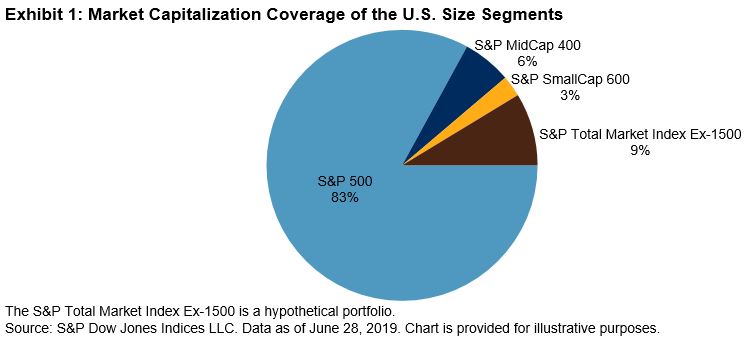
The S&P MidCap 400 is designed to measure the performance of mid-sized U.S. equities, reflecting this market segment’s distinctive risk/return characteristics. S&P Dow Jones Indices defines mid-cap companies as those with total market capitalizations between USD 2.4 billion and USD 8.2 billion. This range is reviewed by the Index Committee from time to time to assure consistency with market conditions. The committee also considers other criteria—such as a financial viability screen and sector representation—when considering companies for addition to the S&P MidCap 400. Due to the upper bound on the market capitalization thresholds, the S&P MidCap 400 is less concentrated than the large-cap S&P 500. The top 10 companies account for 6.74% of the index weight, which is significantly less than the 22.79% weight held by the top 10 companies in the S&P 500.

Many mid-cap companies may possess a strategic advantage relative to firms of larger or smaller sizes, having successfully navigated the challenges specific to small companies, such as raising initial capital and managing early growth, and now offering stability with the potential of additional growth opportunities. Mid-cap companies have generally overcome the risks of small-cap companies, but they still have the potential to grow before exhibiting the growth deceleration often seen in large-caps. Mid-caps often have established infrastructure, access to capital, and developed distribution systems, but they are still nimble with motivated management teams to take advantage of opportunities quickly.
In the market-cap-weighted structure of indexing, the winners often graduate to the S&P 500, if they aren’t acquired first, and the losers decrease in weight and may even leave the index, making the overall index weighted more heavily with relative winners. Without knowing exactly which ones will be the big winners, allocating to the whole basket makes sense. From Jan. 1, 2014, to June 28, 2019, 77 S&P MidCap 400 components graduated to the S&P 500, 79 were demoted to the S&P SmallCap 600, and another 111 were acquired.

Additionally, the mid-cap segment has unique valuation characteristics. The S&P MidCap 400 maintains a similar trailing price-to-earnings ratio to the S&P 500, indicating similar valuations of mid-cap and large-cap companies. Meanwhile, the price-to-book value and price-to-sales ratios are much more similar to the small-cap segment, represented by the S&P SmallCap 600. These potential strategic advantages of the individual components and sector allocations may help to explain the mid-cap segment’s fundamentals relative to the large- and small-cap segments. On average, the S&P MidCap 400 has historically had higher exposures to Real Estate, Utilities, and Materials, and has been underweight Information Technology and Health Care.

With an overview of what makes the mid-cap segment distinct, take a closer look at the driving forces behind mid-caps’ outperformance (including stock versus sector selection and factor exposure), gauge how mid-cap active funds fare against their passive counterparts, and explore the potential benefits of dialing up exposures in core portfolios. Check out the latest research here to learn more.
The posts on this blog are opinions, not advice. Please read our Disclaimers.