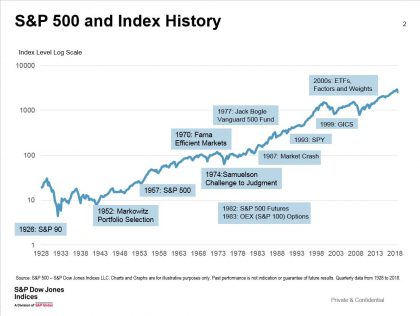
This is more an eyewitness account than an analytical review of the growth of indexing since I joined S&P in 1982.
The growth in indexing in the 20 years from S&P 500 futures in 1982 to the bottom of the tech bear market in 2002 was just a warm up. Two trends encouraging index growth reached critical mass in the 2000s: ETFs with low fees and attractive performance combined with the rise of discount brokerage. Discount brokerage began in 1975 when fixed commission rates ended. The earliest online brokers dated from 1991. In the aftermath of the tech bust investors were concerned about fees, wanted transparency and diversification – demands that ETFs and discount brokerage could meet.
The number and variety of indices broadened as well. The S&P Midcap 400 and S&P Small Cap 600 joined the S&P 500 in the 1990s. Reaching beyond the home market, S&P adding the IFC emerging market indices in 1997. Next came exchange agreements in Canada and Australia in 1998 and 2000 and the BMI global equity indices in 2003.
In 1999, S&P and MSCI developed the Global Industry Classification Standard (GICS) to give investors a consistent way to categorize companies into sectors and industries. With GICS, an analyst following the S&P 500 could know how much the market rose and what industries or sectors drove the gains. Using indices defined by GICS, she could choose which sector to invest in or how to re-weight the sectors in the S&P 500.
Indexing was never limited to equities and stock markets. S&P’s first bond indices designed to support ETFs were introduced in 2000 covering municipal bonds. In 2006, S&P began working with Robert Shiller, Yale economics professor, to publish indices on home prices in selected cities around the US. The indices, now known as the S&P Corelogic Case-Shiller Home Price Indices, became a key benchmark of home values during the financial crisis. A year later in 2007 S&P acquired a leading commodity futures index, S&P GSCI, from Goldman Sachs.
The Global Financial Crisis and Great Recession of 2007-2009 gave us the second 50% bear market this century. The S&P 500 fell 56.8% from October 9, 2007 to March 9, 2009. In the aftermath of a bear market some promise never to invest in stocks again, others look for new ways to build an index.
Factor indices were one new way. Rather than select stocks by size or sector, factor indices identify factors that affect stock performance and design indices which include desirable factors. One factor index introduced in response to the bear market and the financial crisis was the S&P 500 Low Volatility Index. As the name suggested, it is intended to be less volatile – maybe less worrisome – than the S&P 500. Many others followed.
With the development of factor indices, index providers mounted a new challenge to active management and stock picking. The initial thrust of indices was tracking the entire market with minimal expense. Investors benefited because few managers seemed to consistently pick the right stocks. The goal of factor indices is two-fold: adopt strategies based on the same academic research active managers follow combined with the lower expense structures of ETFs tracking indices. Many indices S&P DJI introduces today build on factors and similar strategies.
A major event for both S&P Indices and Dow Jones Indexes was joining two major index groups in 2012. Together they became S&P Dow Jones Indices bringing the two best-known equity indices – the Dow Jones Industrial Average and the S&P 500 – into the same organization. The DJIA traces its history back to 1896 and a predecessor index to 1884. The S&P 500 became 500 stocks in 1957 when it was developed from an earlier index, the Standard Statistics 90 Stock Index that started in 1926.

The market has changed a lot since S&P 500 futures started. The number of listed equities in the US peaked in 1997 at about 7500; today there are slightly less than 4000 stocks. The recent corporate tax cuts may encourage some limited partnerships to convert to C-corporations adding some larger names to the market. Due to the tech booms of the 1990s and the last ten years, some of the names at the top of the S&P 500 are relatively youthful and joined the index recently: Google joined the index in 2006, Amazon in 2005 and Facebook in 2012. Two older tech names are Microsoft added to the S&P 500 in 1994 and Apple added in 1982. Berkshire Hathaway joined in 2009 when it acquired Burlington Northern and split its class B stock. Currently the five biggest names in the S&P 500 do not include any banks or oil companies.
Estimates of the percentage of the US equities in index portfolios, funds and ETFs vary from 15% to almost 50%. Indexing is here to stay and is likely to grow further. We will never see a time when the whole market is indexed. More importantly, as indices based on factors, sectors, ESG requirements and other approaches join float adjusted market cap indices there will be no less diversity in the market. One factor index will rebalance out of a stock while another rebalances into the same stock.
Part 1 covered the period from 1982 to 2002
The posts on this blog are opinions, not advice. Please read our Disclaimers.