Indices based on factors such as low volatility and quality generally have defensive characteristics. These strategies tend to outperform the broad benchmark in down markets, as previous studies have shown. Yet some market participants also believe that active management fares somewhat better than the benchmark in periods of volatility and distress. In 2018, the S&P 500® rallied 10.56% in the first three quarters and lost 13.52% in the fourth; this provides a good test to compare actively managed mutual funds against passive defensive factor strategies and see which rode the rollercoaster better. In our test, we also include the S&P 500 Equal Weight Index.
Different factors deliver different investment results, due to unique defensive mechanisms. In 2018, low volatility and dividends outperformed while quality lagged, compared with the median performance of all large-cap mutual funds. In the long term, when cyclicality of the market has been smoothed out, all these passive strategies tended to outperform the majority of actively managed mutual funds (see Exhibit 1).

In 2018, 64% of large-cap active funds underperformed the broad market, but even more managers underperformed the S&P 500 Low Volatility Index (88%) and the S&P 500 Dividend Aristocrats® (73%). Though quality has been considered a defensive factor, it did not perform as well as low volatility or dividends in 2018. Meanwhile, nearly 57% of active large-cap managers beat the S&P 500 Quality Index.
In the five-year period ending December 2018, the S&P 500 Low Volatility Index and S&P 500 Dividend Aristocrats outperformed over 85% of the large-cap active managers. In addition, over 66% of active large-cap funds had lower returns than the S&P 500 Equal Weight Index and the S&P 500 Quality Index.
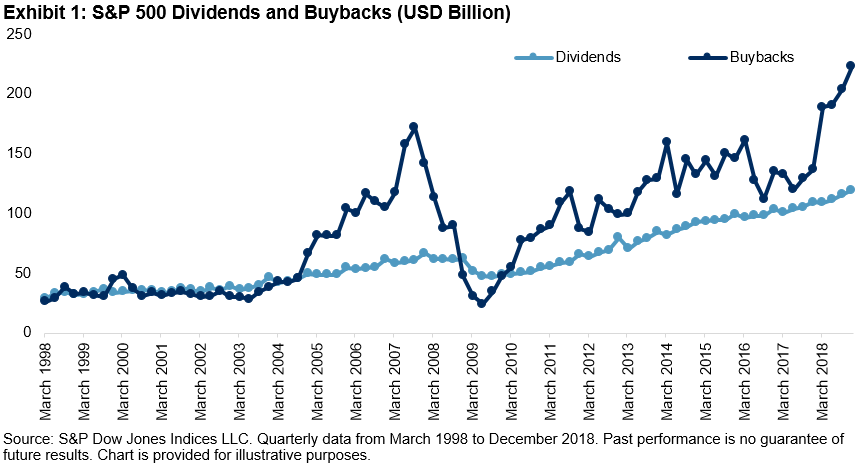
Over the longer-term 15-year period, all four factor indices outperformed more than 98% of the large-cap mutual funds. This is not surprising, given that these defensive factor indices historically tend to have higher hit rates and excess returns in down markets (see Exhibit 2).
Financial market performance in 2018 clearly can be split into two periods. Despite the flash crash in February and heightened market volatility in April, the first three quarters saw a strong rally thanks to solid corporate earnings. However, in the fourth quarter, uncertainty over global economic growth and future Fed policy wiped out the year’s gains for many equity benchmarks. This happened in all the defensive factor strategies as well as the two reference indices (see Exhibit 3).

Exhibit 3 clearly shows the source of 2018 outperformance for the low volatility and dividend factors: lower beta and less cyclical companies, which lagged the broad market rally in the first three quarters but created far less drawdown in the fourth quarter market shakeup. Both the S&P 500 Low Volatility Index and the S&P 500 Dividend Aristocrats have a higher percentage of these firms than the S&P 500.
The S&P 500 Quality Index did not fare as well in 2018 due to its sector composition. This index selects securities based on their quality score, which is a composite of three fundamental ratios: balance sheet accruals ratio, return on equity (ROE), and financial leverage ratio. The use of a profitability metric or ROE significantly increased the index’s weight in Information Technology, which posted an 18% loss in the last quarter of 2018, while reducing the index’s allocation to Health Care, Biotechnology in particular, which posted a return of 15% during the first three quarters of 2018.
The posts on this blog are opinions, not advice. Please read our Disclaimers.
 Source: S&P Dow Jones Indices LLC. Data as of Apr. 19, 2019. Data has been based at 100. Past performance is no guarantee of future results. Chart is provided for illustrative purposes.
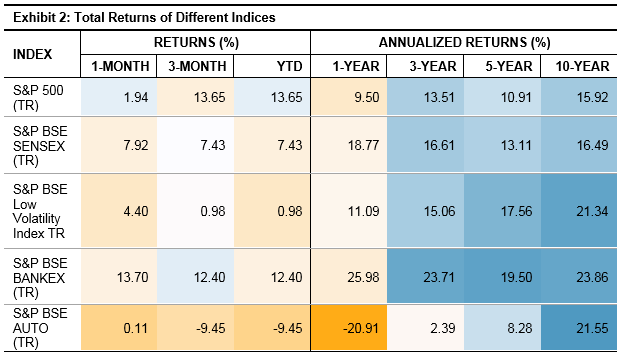 Source: S&P Dow Jones Indices LLC. Data as of Mar. 29, 2019. Past performance is no guarantee of future results. Table is provided for illustrative purposes.