In this blog (and three subsequent posts) we will explore using Growth at a Reasonable Price (GARP) principles for investment in indices. GARP is a well-known, much-practiced, fundamental-driven investment strategy. It seeks to balance between the pure growth strategy and pure valuation strategy, as the former tends to chase high growth yet expensive stocks, while the latter can take years to realize. At the heart of it, in practice, the GARP strategy seeks to invest in companies with the following characteristics: consistent earnings and sales growth; reasonable valuation; and solid financial strength combined with strong profitability.
The construction of a GARP strategy combines growth, value, and quality factors into one process. A rules-based, transparent index solution shows the details. In this blog, we will outline the framework and the steps involved.
Establishing the Multi-Factor Framework
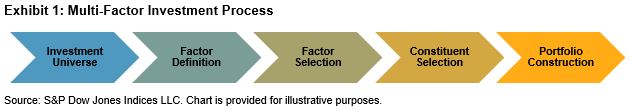
We use a systematic bottom-up approach for stock selection and portfolio construction. As illustrated in Exhibit 1, we can summarize the steps as follows.
- Define your investment universe.
- Identify factors with the potential to capture your investment strategy.
- Select sensible factors for multi-factor metrics.
- Select constituents with well-defined rules.
- Construct a constituent portfolio with a predefined weighting methodology.
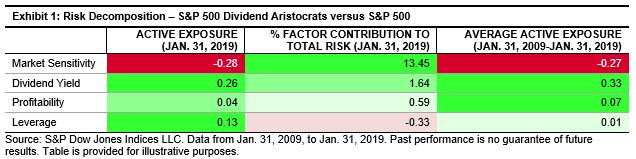
For our S&P 500® GARP Index, we use the S&P 500 as the investment universe and a sequential filtering approach to select constituents. The objective of a GARP strategy is to invest in growth stocks with good quality and attractive valuation. Exhibit 2 shows the appropriate style and factor components[1] for the GARP strategy.

We use three-year EPS[2] and SPS[3] growth metrics to capture a firm’s growth. In order to maintain sustainable growth, a firm needs to be highly profitable (high ROE[4]) and not built on excessive leverage (low financial leverage ratio[5]). Moreover, we use the earnings-to-price ratio[6] to gauge a firm’s reasonable valuation. With these metrics, we implement a hypothetical GARP strategy.
Style and Factor Score Calculation
Score calculation is an integral step of any multi-factor strategy. We calculate the growth z-score and QV composite z-score for each of the stocks in the eligible universe. The growth z-score[7] is calculated as the winsorized z-score[8] average of two factors: the three-year EPS growth and three-year SPS growth. If a z-score for one factor is not available or properly calculated, the z-score of the other factor will be used as the growth z-score.
Next, we compute the QV composite z-score as the winsorized z-score average of three factors: financial leverage ratio,[9] ROE, and earnings-to-price ratio. A stock needs to have a quality and a value score. If the z-score for one of the quality scores can’t be properly calculated, the z-score of the other quality factor will be used.[10]
With style and factor scores in place, we proceed to the third step of the multi-factor investment process—security selection. Here we utilize a sequential filtering process, one of the several possible approaches to forming a multi-factor index.
In the next blog, we will take a deeper dive into the third and the fourth steps in our GARP strategy construction.
[1] Outlier fundamental ratios are winsorized to ensure that the average values used to calculate the overall component score are less distorted by extreme values. For a given fundamental variable, the values for all securities are first ranked in ascending order. Then, for securities that lie above the 97.5 percentile rank or below the 2.5 percentile rank, their value is set as equal to the value of the 97.5 percentile ranked or the 2.5 percentile ranked security, whichever is applicable.
[2] The three-year EPS growth is calculated as a company’s three-year EPS compound annual growth rate (CAGR) for each security in the index universe as of the rebalancing reference date.
[3] The three-year SPS growth is calculated as a company’s three-year SPS CAGR for each security in the index universe as of the rebalancing reference date.
[4] The ROE is calculated as a company’s trailing 12-month EPS divided by its latest BVPS for each security in the index universe as of the rebalancing reference date.
ROE = EPS/BVPS
[5] The financial leverage ratio is calculated as a company’s latest total debt divided by its book value per share (BVPS) for each security in the index universe as of the rebalancing reference date.
Leverage = Total Debt/(BVPS * Common Shares Outstanding)
[6] The earnings-to-price ratio is calculated as a company’s trailing 12-month EPS divided by its price (P) for each security in the index universe as of the rebalancing reference date.
Earnings-to-Price = EPS/P
[7] Using the winsorized growth z-score, a growth score is computed for each of the securities. For a given security, if its winsorized growth z-score is above 0, then its growth score will be 1 plus the winsorized growth z-score. On the other hand, if its winsorized growth z-score is below 0, then its growth score will be the result of the reciprocal of 1 subtracts its winsorized growth z-score.
If average z > 0, Growth Score = 1 + z.
If average z < 0, Growth Score = (1 / (1 – z)).
If average z = 0, Growth Score = 1.
[8] Computing a z-score is a widely adopted method of standardizing a variable in order to combine it with other variables that may have a different scale or unit of measurement. After winsorizing all the fundamental ratios, the z-score for each of the relevant ratios for each security is calculated using the mean and standard deviation of the relevant variable within each of the index universes.
In general, the z-score is calculated as follows:
??= -(??−??)/??
For each security, the average z-score is computed by taking a simple average of the relevant scores. Where there is a missing value, the average z-score is computed by taking a simple average of the remaining scores. A security must have at least one z-score for it to be included in the index.
[9] The z-score for the financial leverage ratio is calculated as follows: ??= -(??−??)/??
where:
?? = z-score for a given security
?? = winsorized variable for a given security
?? = arithmetic mean of the winsorized variable in a given index universe, excluding any missing values
?? = standard deviation of the winsorized variable in a given index universe
[10] Outlier average z-scores are winsorized to ensure that the overall growth scores are less distorted by extreme values. To do this, for a given average z-score, the values for all securities are first ranked in ascending order. Then, for securities that lie above 4 or below -4, their value is set as equal to 4 or -4, whichever is applicable.
The posts on this blog are opinions, not advice. Please read our Disclaimers.