Get Indexology® Blog updates via email.

In This List

S&P 500® Dividend Aristocrats®: Risk Decomposition and Sector Composition

S&P 500 Cboe Target Outcome Indexes – Investor Applications

Finding Better Beta in the International Small-Cap Markets

New Additions to the S&P 500® Dividend Aristocrats® Class of 2019

Access the S&P 500 with Built-in Buffers

S&P 500® Dividend Aristocrats®: Risk Decomposition and Sector Composition

Contributor Image
Karina Tjin

Former Analyst, Strategy Indices

S&P Dow Jones Indices

Today we examine the impact of the members of the S&P 500 Dividend Aristocrats Class of 2019 on the index’s factor risk and sector composition. In our previous blog, we introduced these new constituents and discussed their quality ranking.

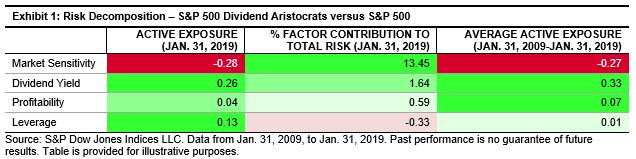
Risk decomposition of the S&P 500 Dividend Aristocrats using Axioma’s US Fundamental Equity Risk Model MH4 supports the view that the index contains elements of the quality factor. Our definition of quality uses return on equity, accruals ratio, and financial leverage ratio. Of these three calculations, Axioma’s Risk Model decomposes risk into profitability (return on equity) and leverage. A snapshot of the index on Jan. 31, 2019, shows us that the index is more actively exposed to those two factors than is the S&P 500, with profitability’s active exposure at 0.04 and leverage’s at 0.13. Profitability’s contribution to risk is relatively small at 0.59%, and leverage reduces it by 0.33%.

Moreover, the average active exposure for the 10-year period studied was 0.33 and -0.27 for dividend yield and market sensitivity, respectively. In other words, the S&P 500 Dividend Aristocrats achieved higher dividend yield than its benchmark, and at the same time was less sensitive to the market. This shows us that the index was more quality oriented, had lower active exposure, and achieved higher yield than the benchmark.

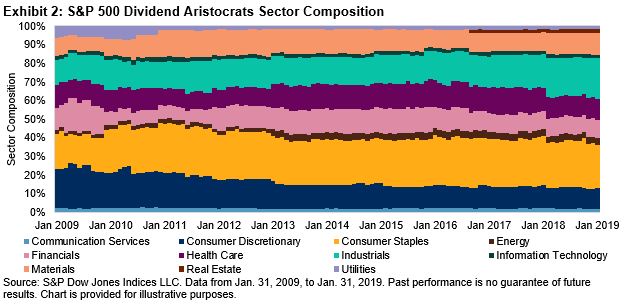
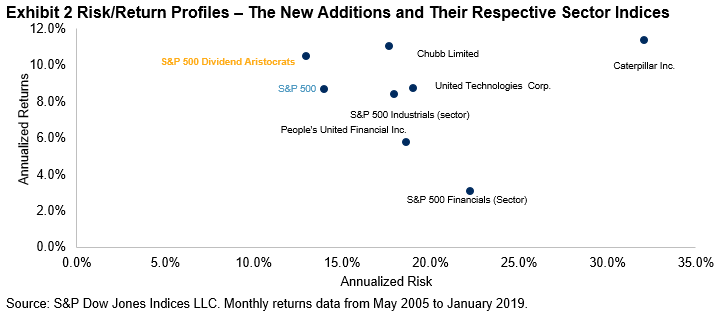
Exhibit 2 shows that the S&P 500 Dividend Aristocrats had heavy Consumer Staples and Industrials sector biases. The Class of 2019 further shifts the bias toward the Industrials sector, from a weight of 20.8% to 21.6%. This is significant because half of the companies added to the index were from the Industrials sector and the index constituents are equally weighted (Consumer Staples index weight was 23.4%).

In the S&P 500, the Consumer Staples and Industrials sectors have much lower weights, of 7.2% and 9.5%, respectively. The weight difference between the benchmark and the S&P 500 Dividend Aristocrats suggests that the latter’s Consumer Staples and Industrials sectors may have more quality due to their greater ability to provide consistent dividends.  The new constituents of the S&P 500 Dividend Aristocrats Class of 2019 not only enhance the quality factor of the index, but also deepen the Industrials sector bias.

In our next blog we will discuss the historical performance of the S&P 500 Dividend Aristocrats.

The posts on this blog are opinions, not advice. Please read our Disclaimers.

S&P 500 Cboe Target Outcome Indexes – Investor Applications

Contributor Image
Matt Kaufman

Principal and Senior Director, Head of Distribution and Product Development

Milliman Financial Risk Management LLC

Many investments today target speculative returns, with uncertain levels of risk, over an uncertain period of time. While opportunistic, this approach to investing often brings a high degree of uncertainty. Outcome based investing encourages targeting a specific defined payoff profile, with an allowance for a specific defined level of risk, at a specific point in time in the future. Cboe S&P 500 Target Outcome Indexes work differently, by seeking to incorporate defined exposures to the S&P 500, where the downside protection levels, upside growth potential, and outcome period are all defined, prior to investing. This type of approach exhibits many applications for multiple investor types. We explore a few here:

  1. As a Growth Engine: Investors seeking enhanced growth with non-enhanced downside risk may consider replacing a portion of their domestic equity exposure with an Enhanced Growth Target Outcome Index.
  2. As a Risk Management Tool: Managing portfolio risk has historically been accomplished through fixed allocations to fixed income assets in order to meet a long-term risk tolerance level, or through more tactical measures that allocate away from stocks when markets become volatile. With Cboe Buffer Protect Indexes, the implied volatility of the S&P 500 is intended to contribute positively to upside caps. Conversely, in times of low implied volatility, upside caps tend to be lower. This feature is designed to reflect retained investment in the market through all market conditions (regardless of volatility). This is starkly different from most risk management techniques, which reduce equity exposure as volatility increases.
  3. To Meet a Downside Protection Goal: Risk tolerance levels are often established using long-term historical or stochastic volatility data; however, the downside risk investors actually experience over shorter periods may be remarkably different from their expected risk tolerance level. Target Outcome Indexes allow investors to know their downside protection level over an outcome period before they invest.
  4. A Measure of Gap Risk Protection: For many institutional investors, gap risk (the risk of a market movement from one level to another with no trading in between (e.g., the S&P 500 Index dropping substantially from the previous day’s close)) is difficult and expensive to mitigate. Because Target Outcome Indexes provide defined levels of protection over an outcome period, a measure of gap risk protection may be achieved, so long as the relevant investment product tied to the Index is held until the end of the outcome period.
  5. As a Complement to Guaranteed Lifetime Income: A successful retirement often includes multiple sources of income and risk management, which may include guaranteed lifetime income sources such as Social Security, pensions, and annuities. Target Outcome Indexes may be a complement to these income sources, providing liquidity and risk management to a retiree’s investment portfolio that might not otherwise be available.
  6. Take a View on the Market: Investors looking to take a tactical position on the market may often use enhanced growth strategies in modest bull or range-bound market environments that experience normal or elevated levels of volatility, and buffer protect strategies in bear or range-bound markets.

The posts on this blog are opinions, not advice. Please read our Disclaimers.

Finding Better Beta in the International Small-Cap Markets

Contributor Image
Hamish Preston

Head of U.S. Equities

S&P Dow Jones Indices

S&P Dow Jones Indices recently launched the S&P Global SmallCap Select Index Series.  These indices aim to provide broad market exposure to small-cap equities around the world that have a track record of generating positive earnings.

As prior S&P DJI research highlighted, the S&P SmallCap 600® outperformed the Russell 2000 by around 2% on an annualized basis over the last two decades.  A large reason for this outperformance stemmed from the S&P 600’s significant exposure to quality; unlike the Russell 2000, the S&P 600 incorporates a positive earnings screen and so it has a greater bias towards profitable small-cap companies.

The newly launched small-cap select indices incorporate a similar positive earnings screen to that used in the S&P 600, and there is clear evidence it would have helped market participants seeking international small-cap exposure.  For example, all of the S&P Global SmallCap Select indices provided greater returns and lower volatilities compared to their less discerning counterparts over the last 15 years.  Since similar results are observed over shorter horizons, the performance characteristics suggest the select indices have raised the bar in small-caps and may serve as better benchmarks.

Another way to assess the effect of incorporating a profitability screen in the small-cap space is to switch benchmarks in our S&P Indices Versus Active (SPIVA®) scorecards.  Over the 15-year period ending December 2018, around three in every four managers lagged the S&P Developed Ex-U.S. Small Cap’s 7.5% annualized total return.  In contrast, around five in every six international small-cap funds underperformed the S&P Developed Ex-U.S. Small Cap Select’s 8.3% annualized total return.  Similar results were found in the U.S. small-cap category; nearly 90% of managers lagged the S&P 600’s 9.2% annualized gain over the 15-year period, whereas nearly 80% failed to beat the Russell 2000’s 7.5% annualized return.

As a result, incorporating earnings screens in the small-cap universe has been an effective way to eliminate unprofitable companies without sacrificing returns or resulting in higher volatility.  And while the majority of active international small-cap funds underperformed the traditional small-cap benchmark, an even higher proportion lagged the S&P Developed Ex-U.S. Small Cap Select.  Hence, market participants seeking broad market exposure to international small cap space may be better served by selecting this next generation of small-cap benchmarks.


The posts on this blog are opinions, not advice. Please read our Disclaimers.

New Additions to the S&P 500® Dividend Aristocrats® Class of 2019

Contributor Image
Smita Chirputkar

Former Director, Global Research & Design

S&P Dow Jones Indices

The December 2018 rebalance of the S&P 500 Dividend Aristocrats added four new companies, with the changes effective at the open of Feb. 1, 2019. The new firms are Caterpillar Inc., Chubb Limited, People’s United Financial Inc., and United Technologies Corp. These four companies have the distinguishing characteristics that allow them to be eligible for inclusion in the S&P 500 Dividend Aristocrats.

The S&P 500 Dividend Aristocrats is designed to measure the performance of S&P 500 constituents that have a record of increasing dividends every year for at least the past 25 consecutive years. The index now comprises 57 securities.

Exhibit 1 compares these firms’ characteristics to both the S&P 500 and S&P 500 Dividend Aristocrats. The S&P 500 Dividend Aristocrats historically reflected higher yields than the S&P 500. The newly added members also displayed the same higher yield characteristics as of the close of Feb. 25, 2019.

On average, the S&P 500 Dividend Aristocrats is less volatile than the S&P 500, as exhibited by a beta of 0.8.[1] Two of the newly added members displayed a similar trend of lower beta compared to the S&P 500 (during an analysis period from May 2005 to February 2019).

To see how the newly added securities stack up against their respective sectors, we looked at their risk/return characteristics over the period from May 2005 to January 2019 (see Exhibit 2). Historically, the S&P 500 Dividend Aristocrats outperformed the S&P 500 with lower volatility, as shown by the higher Sharpe ratios, regardless of the time horizon being measured.[2] The newly added Financials stocks showed higher Sharpe ratios than the sector index, the S&P 500 Financials, while the newly added Industrials stocks showed Sharpe ratios similar to that of the S&P 500 Industrials.

Our previous study shows that the S&P 500 Dividend Aristocrats outperformed the S&P 500 about 71% of the time when the benchmark was down[3] (during an analysis period from Jan. 31, 1990, to Dec. 31, 2018). In this context, we looked to see if the new constituents were also featured in other factor indices such as the S&P 500 Low Volatility Index and the S&P 500 Low Volatility High Dividend Index. As shown in Exhibit 3, two of the four newly added members have also exhibited low volatility along with high dividend yield characteristics, and they are a part of the respective S&P Factor Indices.

Conclusion

The addition of 4 new members brings the number of securities in the S&P 500 Dividend Aristocrats to 57. Of the new additions, 3 are well-established companies, each with over 75 years of corporate history. The newly added constituents have shown trends of higher dividend yields similar to the other constituents of the S&P 500 Dividend Aristocrats. The new members have also provided Sharpe ratios higher than or similar to their corresponding S&P 500 sector indices during the analysis period.

[1] Soe, Aye and Chirputkar, Smita, “A Fundamental Look at S&P 500 Dividend Aristocrats,” S&P DJI.

[2] Soe, Aye and Chirputkar, Smita, “A Fundamental Look at S&P 500 Dividend Aristocrats,” S&P DJI.

[3] Soe, Aye and Chirputkar, Smita, “A Fundamental Look at S&P 500 Dividend Aristocrats,” S&P DJI.


The posts on this blog are opinions, not advice. Please read our Disclaimers.

Access the S&P 500 with Built-in Buffers

Contributor Image
Matt Kaufman

Principal and Senior Director, Head of Distribution and Product Development

Milliman Financial Risk Management LLC

Earlier in 2018 S&P Dow Jones Indices, Cboe Global Marketssm, and Milliman Financial Risk Management LLC collaborated to build four new series of Target Outcome Indexes, designed to reflect defined exposures to the S&P 500 Index, where the downside protection levels, upside growth potential, enhancement level, and outcome period are all pre-determined.

Each Series consists of four quarterly issued indexes (January, April, July, and October—16 indexes total) that reset annually.

Buffer Protect Series

Cboe S&P 500 15% BUFFER PROTECT INDEX SERIES

  • SPRF-01 (January), SPRF-04 (April), SPRF-07 (July), SPRF-10 (October)

Cboe S&P 500 30% (-5% TO -35%) BUFFER PROTECT INDEX SERIES

  • SPRF-01 (January), SPRF-04 (April), SPRF-07 (July), SPRF-10 (October)

Enhanced Series

Cboe S&P 500 3X UP, 1X DOWN ENHANCED GROWTH INDEX SERIES

  • SPEG-01 (January), SPEG-04 (April), SPEG-07 (July), SPEG-10 (October)

Cboe S&P 500 2X UP, 1X DOWN, 10% BUFFER PROTECT INDEX SERIES

  • SPEB-01 (January), SPEB-04 (April), SPEB-07 (July), SPEB-10 (October)

Solving a Key Challenge: Providing Simple Access to Structured Outcomes

The approach taken by the Target Outcome Indexes is analogous to certain equity-linked strategies used in structured products and structured annuities—a space with nearly $1 trillion in combined assets in the U.S. alone. As large as the structured product space has become, it has historically been accessed by institutional and high net worth investors, and has been largely ignored by retail investors, the financial press, and product developers.

We surmise one key reason for this is that the structured product space has never truly addressed one of its biggest challenges regarding the investing public, which is to devise a simple and transparent approach that investors could easily access and follow.

In our view, solving this challenge through an index based approach can provide unprecedented access to structured outcomes for institutional investors and financial advisors, and establishes liquidity and transparency within an otherwise complex and opaque space.

Cboe Target Outcome Indexes were built to replicate features of the largest structured product category, which are tied to the return of an underlying equity asset, like the S&P 500 Index.

Creating Defined Exposures to the S&P 500

Each Cboe S&P 500 Target Outcome Index seeks to reflect defined exposure to the S&P 500 Price Index (S&P 500) through four parameters:

Defined Parameters of Target Outcome Indexes

  1. Equity Market Exposure: S&P 500 Index. Target Outcome Indexes reflect exposure to broad equity markets on which there are liquid underlying derivatives markets; in this case the S&P 500—a broad measure of U.S. large cap equities.
  2. Defined Downside Protection Levels: 0%, 10%, 15%, 30%. Target Outcome Indexes seek to incorporate defined levels of downside protection (e.g., 0%, 10%, 15%, and 30%) over each Index’s outcome period. For example, if at the end of the outcome period the S&P 500 is down 20%, it is expected that a target outcome strategy with a 15% protection level would be down 5%. Note: the Cboe S&P 500 30% (-5% to -35%) Buffer Protect Index seeks to provide a 30% buffer from -5% to -35%, exposing investors to the first 5% of losses relative to the S&P 500.
  3. Defined Upside Growth Potential: 1x, 2x, 3x to a cap. Cboe Target Outcome Indexes seek to incorporate upside growth relative to the S&P 500, to a cap. Each Index also exhibits an upside participation rate, which is an enhancement factor that represents the amount of upside exposure the index return is multiplied by, over the outcome period and subject to a cap. The upside growth is either 1x (no enhancement), 2x, or 3x. The enhancement factor is only applied to the upside growth of the Index. Downside exposure is on a one-to-one basis, over the outcome period (not accounting for any protection levels).
  4. Defined Outcome Period: One Year. Cboe Target Outcome Indexes seek to reflect target outcomes over a one-year outcome period, at which point each Index resets (i.e., “rolls”). Investors may be familiar with certain investment products that seek to deliver both upside and downside exposure (often leveraged) to an asset over a daily or weekly point-to-point period. The Cboe Target Outcome Indexes seek to incorporate upside enhancement and/downside protection levels on an annual point-to-point period.

The Index methodology sets the equity market exposure, downside protection level, upside enhancement level, and outcome period for the life of each Index. The upside cap is established at the beginning of each outcome period.

The posts on this blog are opinions, not advice. Please read our Disclaimers.