Get Indexology® Blog updates via email.

In This List

Beyond the SPIVA® Europe Mid-Year 2018 Headlines – Delving Deeper Into the Data

Index-Based Investing: A Simple Solution

SPIVA® Latin America Mid-Year 2018 Results

Carbon Costs – LatAm Analysis

Developing Expectations for Long-Term U.S. Stock Returns

Beyond the SPIVA® Europe Mid-Year 2018 Headlines – Delving Deeper Into the Data

Contributor Image
Andrew Innes

Head of Global Research & Design

S&P Dow Jones Indices

The S&P Indices Versus Active (SPIVA) Europe Mid-Year 2018 Scorecard is often cited for its latest headlines surrounding the active vs. passive debate. But beyond the SPIVA headlines, there is an extensive offering of insightful data that has been carefully measured and presented to help readers dig deeper.

Let’s look at just one example from the latest SPIVA Europe Scorecard and discuss the treasure trove of information that can be gleaned from the report.

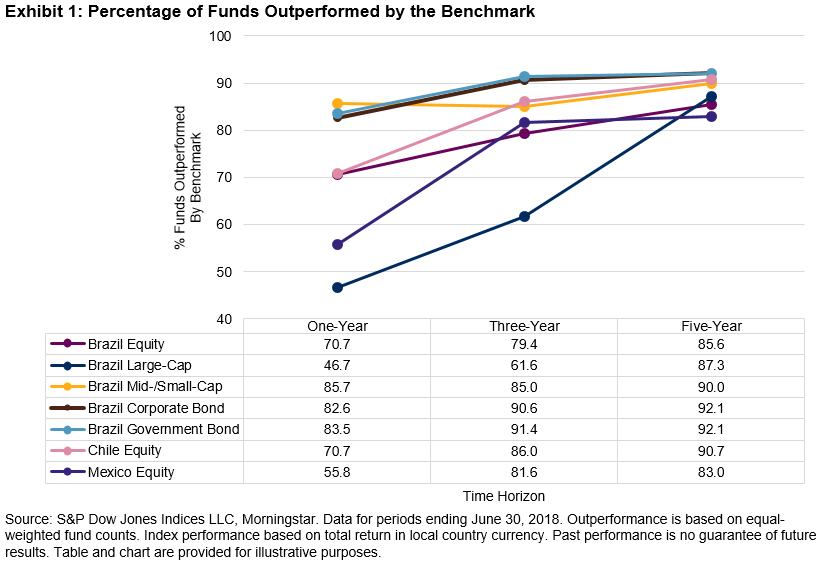
Headline: 59% of active pan-European equity funds (euro-denominated) failed to beat the S&P Europe 350 from June 2017 to June 2018.

  1. Appreciating the Longer-Term Trends

First, how does this headline figure compare to its track record over longer time periods and to other fund categories?

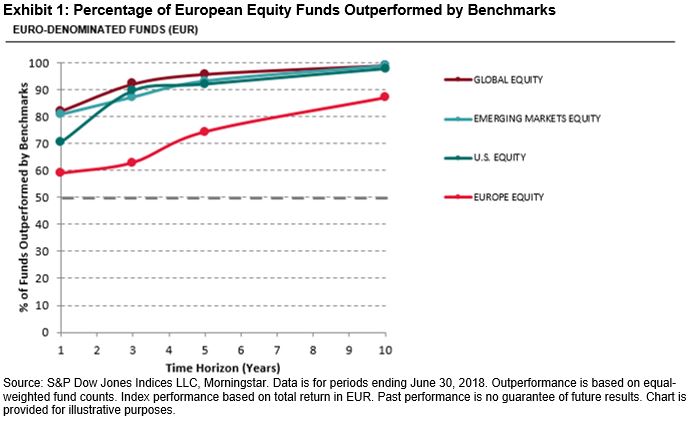
The proportion of funds in the category failing to beat the same benchmark rose to 87% over the 10-year period. While these figures may appear high, European active funds investing in U.S., global, or emerging market equities appeared to do markedly worse.

  1. Assessing Fund Category Performance

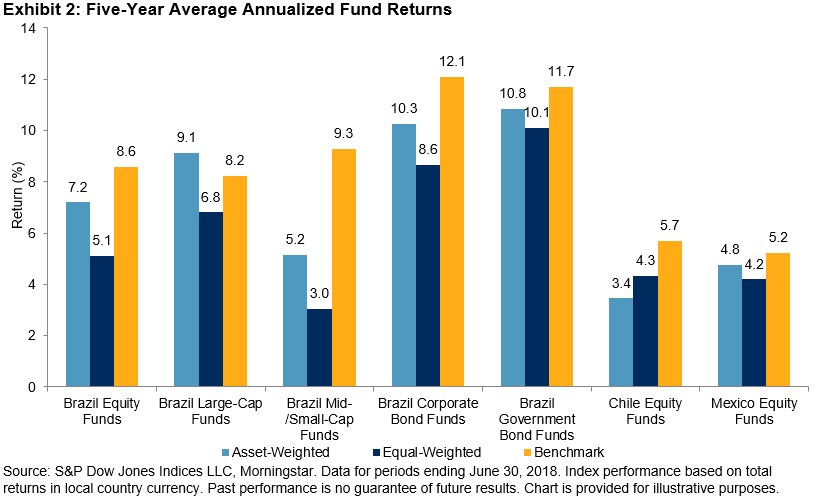
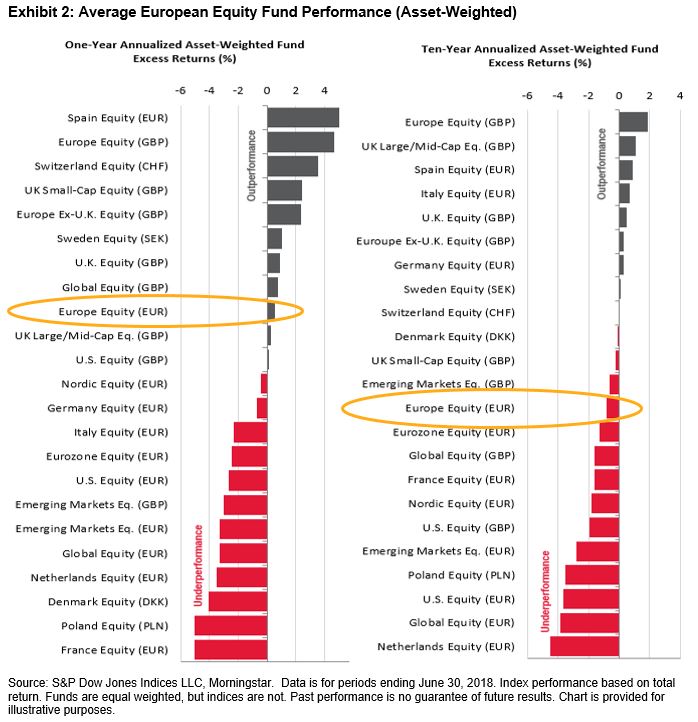
Contrary to what the headline may suggest, active funds investing in pan-European equities collectively outperformed the S&P Europe 350 over the one-year period. The average asset-weighted return for the active fund category was 4.02% from June 2017 to June 2018 (equal-weighted return was 3.75%). In comparison, the S&P Europe 350 one-year return was 3.46%.

Asset-weighted returns may be considered a better indicator of fund category performance compared to equal-weighted returns, since they reflect the returns of the total money invested in that particular category with more accuracy. When asset-weighted returns are higher than equal-weighted return calculations, then we know larger funds typically did better.

See how the returns compared to other fund categories in the one-year period and over longer time periods in Exhibit 2.

  1. Investigating the Distribution of Fund Returns

We already know there must be a skew in the returns across the funds in this category, since the average fund return beat the benchmark while the majority did not. Put another way, the mean was higher than the median return. The quartile breakpoint report (Report 5 in the SPIVA Europe Mid-Year 2018 Scorecard) takes this analysis one step further by giving the performance of the actual fund, which sits at the 25th, 50th, and 75th percentile by rank.

For our headline category, the third quartile fund had a performance of 0.47% in the year; nearly 3% lower than the benchmark. The first quartile fund had a performance of 5.6% in the year; just over 2% better than the benchmark. This imbalance suggests that relatively few funds may have done particularly well.

  1. Analyzing the Survivorship Rates

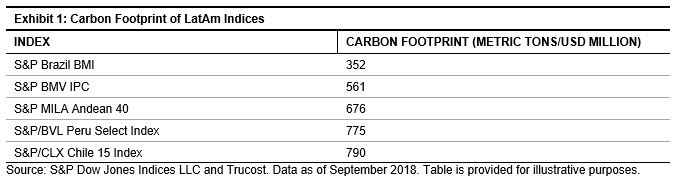
How does the survivorship rate compare to other fund categories and, more importantly, how consistent is it through time?

The survivorship report in the SPIVA Europe Scorecard tells us there were 1,101 funds used to calculate this headline figure. These funds represent the opportunity set available at the beginning of the period in this category. If we were to calculate the figures using only surviving fund data then any conclusions could be biased by excluding funds that would have liquidated or merged due to poor performance.

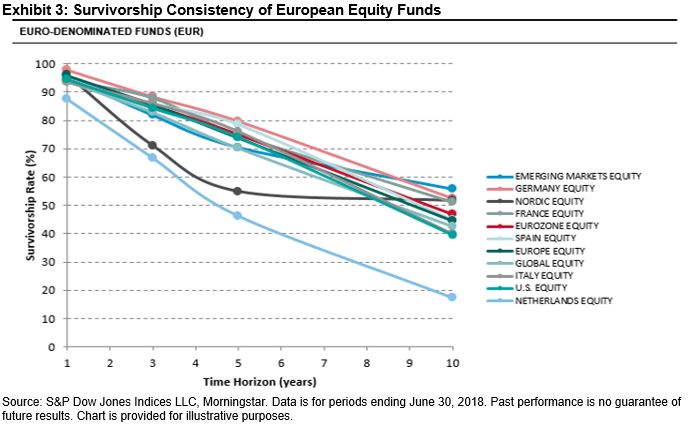
Since the headline figure counts the funds that survived and beat the benchmark index, it is also useful to see the survivorship rate in isolation. In this case, 96% of the 1,101 funds survived the one-year period of analysis. Over the 10-year period, the survivorship rate drops to just 45%. As can be seen in Exhibit 3, this is widely typical across all fund categories.

To take a look at more headlines and all of the related reports that help our readers see the full picture, please see the latest SPIVA Europe Mid-Year 2018 Scorecard.

The posts on this blog are opinions, not advice. Please read our Disclaimers.

Index-Based Investing: A Simple Solution

Contributor Image
Koel Ghosh

Former Head of South Asia

S&P Dow Jones Indices

Making a suitable investment decision among multiple options has always been a dilemma. Market-linked investment options have generally resulted in apprehensive views from conservative investors who sense that equity markets bear heavy risks. Retail investors who lack an understanding of the markets are at risk, as bull runs tend to promote participation. Index-based investing can offer exposure to the markets with diversification, low cost, and transparency.

An index is designed to represent a market, sector, strategy, or theme. Investment strategies that replicate the index seek to align their performance to that index’s returns. For example, if an investment strategy were based on the S&P BSE SENSEX, its one-year annualized returns would be approximately 13% as of Sept. 24, 2018.

In the ongoing active versus passive debate, one could argue that active strategies outperform market beta. Could that be true? Yes, provided that a financial market expert makes all the right calls, coupled with the perfect timing. Is it possible for all investors to be such experts and to be vigilant of market movements in order to get the timing right? What about investable funds that are available for professionals who are not financial experts? There are doctors, engineers, architects, and businesspeople in diverse fields who all need viable investment avenues and are constantly researching investment options or reaching out to investment advisors.

Index-based investing can be a good solution to foray into market-linked returns. An index can provide a diverse basket of securities to manage concentration risk. A diversified market index like the S&P BSE SENSEX or S&P BSE 100 can offer exposure across sectors. Access to index information is also not an issue, as index changes are tracked on a day-to-day basis via multiple channels; index movements are displayed on stock exchange websites, past index trends are available on index provider websites, and there are other sources that provide continuous information on market movements. Index-based products have a lower expense ratio than active investing and are therefore a low-cost option. Indices are designed, calculated, and maintained by a neutral index provider, which ensures transparency, standardization, and a lack of bias in the strategy. Furthermore, there are many options for market segments via indices like the S&P BSE SENSEX 50, S&P BSE 100, S&P BSE 150 MidCap Index, S&P BSE 250 SmallCap Index; sector-based strategies via indices such as the S&P BSE Energy, S&P BSE Finance; and thematic strategies via indices like the S&P BSE India Infrastructure Index, S&P BSE Bharat 22 Index, S&P BSE Low Volatility Index, S&P BSE Quality Index, etc.

The posts on this blog are opinions, not advice. Please read our Disclaimers.

SPIVA® Latin America Mid-Year 2018 Results

Contributor Image
Phillip Brzenk

Managing Director, Global Head of Multi-Asset Indices

S&P Dow Jones Indices

Last week, the SPIVA Latin America Mid-Year 2018 Scorecard was released. The scorecard tracks the performance of active mutual funds in Brazil, Chile, and Mexico through the end of June 2018. Exhibit 1 shows how managers fared against their respective category benchmarks for one-, three-, and five-year lookback periods.

In the short- and long-term periods, most managers were unsuccessful in outperforming their benchmarks. The lone exception was observed in the Brazil Large-Cap category, where a slight majority outperformed over the one-year time horizon. However, longer measurement periods showed similar results to the other categories, with over 87% of managers underperforming over the five-year period.

Exhibit 2 shows the five-year average annualized fund returns on an asset-weighted and equal-weighted basis within each category. Comparing the two return types can give insight into how managers of different sizes (in terms of assets under management) performed.

For all Brazil categories and Mexico, asset-weighted returns were higher than equal-weighted returns; these results suggest larger managers likely performed better than smaller managers. Chile Equity was the sole category in which the equal-weighted return was higher than the asset-weighted return, meaning smaller managers likely did better than larger managers. Fund category returns calculated either way underperformed their respective benchmarks for all categories besides Brazil Large-Cap. For this category, the asset-weighted return was 9.1% annualized, outperforming the benchmark by 0.9%.

Experience the active vs. passive debate on a global scale on Indexology®.

The posts on this blog are opinions, not advice. Please read our Disclaimers.

Carbon Costs – LatAm Analysis

Contributor Image
Neil McIndoe

Head of Environmental Finance

Trucost

For the first time, the main S&P DJI indices in Latin America have been analyzed by Trucost to reveal their exposure to a range of different carbon metrics that prudent investors may want to be aware of.

A central element of the analysis is the estimated portion of earnings that could be lost if the constituent companies were to absorb the additional cost of 2030 carbon prices for their operational emissions and purchased electricity. For the S&P/BVL Peru Select Index, this represents 19% of companies’ EBITDA—for the S&P/BMV IPC, this rises to 42%.

We know that outside death and taxes nothing is certain, but Brazil, Chile, Colombia, Mexico, and Peru have all signed the Paris Agreement—and have carbon targets in place. In Europe, where there are similar commitments, we have seen the price of carbon emissions rise fivefold over the last year.

With these cost implications, companies are being encouraged to report on such matters. In 2017, the G20 set up the Task Force on Climate-related Financial Disclosures, which provided guidance for consistent climate-related financial risk disclosures. Mexico’s government passed the General Law on Climate Change, which set forth requirements for mandatory measurement, reporting, and verification of corporate emissions and established the creation of a National Emissions Registry. In the UK, trustees must update or prepare their statement of investment principles to show how they account for financially material considerations arising from environmental, social, and corporate governance considerations, including climate change. In France, the energy and transition law requires not only companies to report, but also pension funds and investment managers.

The carbon footprint of a company is determined by its direct emissions and those that come from supplier companies including purchased electricity. This is then normalized by USD 1 million in sales. This process can be aggregated to give a figure for a whole index. For the S&P Global 1200, a representative global index, that figure was 279 metric tons/USD million as of September 2018. For the Latin American indices, the figures are shown in Exhibit 1.

It is likely that a transition to a lower-carbon economy will present challenges for the countries of Latin America.  For example, Mexico’s emphasis on trade makes its companies globally competitive. Its main industries include iron and steel, petroleum, automotive, chemicals, and food and beverages. However, these are industries with significant environmental impacts. If companies are to remain competitive, they will have to respond to the challenges and opportunities that a changing economic course presents.

Most investors expect governments to bring forward policies to reduce emissions—and these tend to involve increased costs. Even in the absence of strong government action, it is important for financial institutions to step up to the mark. They may want to prioritize acquiring more detail on sector exposure to natural capital risks. If banks and investors take into account natural capital in their decision-making processes, that in turn will tend to encourage companies to measure, manage, and improve their environmental performance for everyone’s benefit.

The posts on this blog are opinions, not advice. Please read our Disclaimers.

Developing Expectations for Long-Term U.S. Stock Returns

Contributor Image
Philip Murphy

Former Managing Director, Global Head of Index Governance

S&P Dow Jones Indices

In this bull market, by some measures the longest running in U.S. history, investors may wonder what its prospects for continuation are. Judging by rolling quarterly 10-year annualized returns, the S&P 500® does not necessarily seem over-extended. As Exhibit 1 shows, since the end of World War II, large retracements followed lengthy periods of greater-than-10% annualized total returns with significant sub-periods north of 15% per year. The median 10-year annualized total return over the entire post-war period was 11.08%. As of Q2 2018, it was 10.17%, its first quarterly value greater than 10% since Q1 2005. As of Q3 2018, it rose to 11.97%.

On the other hand, backward-looking valuation measures, such as Shiller’s CAPE ratio, paint a less sanguine picture. They generally indicate the market is fully valued, if not over-extended. Exhibit 2 shows 4 regressions of 10-, 7-, 5-, and 3-year forward-looking annualized returns on the CAPE ratio. The explanatory power of the linear regression increases with window length. For example, R2 of the 10-year forward returns is almost 0.52, while R2 of the 3-year forward returns is barely over 0.20. The data are clustered more tightly around their respective regression lines as the forward-looking period grows longer. There is too much random variability to use CAPE as a short-term timing tool, however over longer periods its relationship with future returns grows more significant.

Plugging in the current observed CAPE of about 33ii into the regressions shows that it is signaling low expected returns. For example, using the 10-year regression equation we have:

-0.52% (33) + 19.26% = 2.10%

After inflation, a nominal return of about 2% would probably equate to a near-zero, or even negative, average real return over the coming 10 years.

Nonetheless, backward-looking data may currently be less representative of the future than before. On the positive side for U.S. corporate profits, tax cuts have juiced earnings. But an important question is whether earnings can remain elevated relative to the economy, or whether they have peaked. There is also significant uncertainty about the outlook for global trade, and the prospect that U.S. monetary policy may work at odds with fiscal policy. Therefore, market participants may benefit from incorporating a wide degree of variability into their capital market return expectations. “Moderation” is probably a good word to bear in mind when considering reasonable expectations for U.S. stocks, while granting plenty of room for both downside and upside surprises.

i   French, Kenneth. http://mba.tuck.dartmouth.edu/pages/faculty/ken.french/data_library.html

ii As of Oct. 2, 2018 CAPE was reported on Robert Shiller’s website at 33.18. See http://www.econ.yale.edu/~shiller/data.htm

The posts on this blog are opinions, not advice. Please read our Disclaimers.