In a prior blog, we demonstrated that the S&P 500® Equal Weight Index was a more difficult benchmark to outperform than the S&P 500 over intermediate- to long-term investment horizons. In this blog post, we examine the underlying factor exposures of the S&P 500 Equal Weight Index to evaluate the performance of large-cap managers.
As a starting point, we should note that by deviating from market-cap weighting, an equal-weight index generally displays a small-cap bias, value tilt, and higher portfolio volatility than a broad market-cap-weighted index. For example, the annualized volatility of the S&P 500 Equal Weight Index was 15.81% versus that of the S&P 500 at 14.18%.[1]
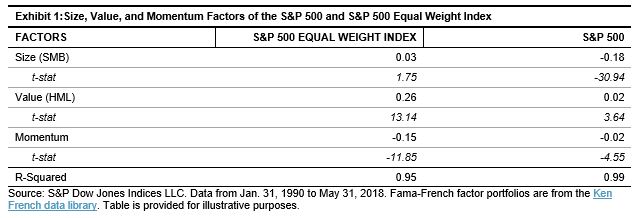
Next, to determine the underlying factor exposures of the indices, we regress the monthly returns of the two indices against the Fama-French factors’ returns, specifically the size, value, and momentum factors. We can see that the S&P 500 Equal Weight Index had higher exposure to the size and value factors and higher negative exposure to the momentum factor (see Exhibit 1) compared with its market-cap-weighted counterpart, the S&P 500.
All the factor coefficients were statistically significant at a 95% confidence level, with the exception of the size factor. These findings were not surprising, as several studies have noted similar results. A research paper by S&P Dow Jones Indices reached a comparable conclusion where the size and momentum factors acted as key drivers of the S&P 500 Equal Weight’s excess returns.[2]
Understanding the factor exposures of the S&P 500 Equal Weight Index allows us to consider a possible framework in which we can potentially evaluate the performance of large-cap active managers on a style-adjusted basis. To be fair, actively managed large-cap funds in our study generally benchmarked themselves against a market-cap-weighted large-cap index, such as the S&P 500 or the Russell 1000. Therefore, one can argue that the S&P 500 Equal Weight Index is not a natural benchmark for these managers, and that they are not managing their portfolios to deliver excess returns over the S&P 500 Equal Weight Index.
However, to the extent that a large-cap manager has an investment process to seek value exposure (or avoid overpaying in general) and to construct a well-diversified portfolio that reduces concentration risk, the underlying risk properties of the S&P 500 Equal Weight Index can be matched up against his/her portfolio. Therefore, we propose that the S&P 500 Equal Weight can serve as a secondary or a supplementary benchmark to the market-cap-weighted S&P 500 to measure the effectiveness of the strategy.
[1] The annualized volatility is from Jan. 31, 1990 to May 31, 2018.
[2] Edwards, T., Lazzara, C., Preston, H., and Pestalozzi, O. “Outperformance in Equal-Weight Indices.” S&P Dow Jones Indices LLC. January 2018.
The posts on this blog are opinions, not advice. Please read our Disclaimers.