Small caps have materially outperformed large caps in 2018, with the S&P SmallCap 600 outpacing the S&P 500 7.80% to 2.58% between Dec. 29, 2017, and May 25, 2018.1 Below, I highlight what I believe to be the drivers of small-cap returns this year, and why I believe the trend could continue.
Tax cuts have benefited small caps. In the three years ending December 2017, the companies in the S&P SmallCap 600 had an average effective tax rate 4.3% higher than the S&P 500.1 Investors looking for stocks that may experience improved profitability due to US tax reform seem to have turned to the small-cap sector.
Trade tensions may favor small caps. 2018 has been a year of trade tensions, but smaller companies tend to have less overseas exposure than larger companies. S&P SmallCap 600 companies generated 78.8% of their revenues from the US compared to 70.9% for the S&P 500.2 The difference was even more dramatic in the growth style box, where S&P SmallCap 600 Growth companies produced 80.6% of their revenue from the US compared to 65.1% for S&P 500 Growth companies.2 The recent political tensions in Italy and Spain and the potential threats to economic growth in the eurozone may prompt investors to reduce their overseas exposure and benefit small caps relative to large caps.
The trend in earnings estimate revisions favors small stocks over large. Earnings estimate revisions have been strongest in the small-cap sector. Forward earnings estimates for the S&P SmallCap 600 have risen by more than 28% compared to 18.7% for the S&P 500 over the past six months.3
The US economy has shown relative strength. More recently, the US economy has continued to display strong growth, while economies in Europe and Asia have softened. The IHS Markit Eurozone Manufacturing PMI has declined from a peak of 60.6 in December 2017 to a recent low of 55.5 in May 2018, while the Nikkei Japan Manufacturing PMI has eased from a January 2018 high of 54.8 to a recent low of 52.8 in May.4 In contrast, the IHS Markit US Manufacturing PMI was just below its cycle high at 56.4 in May.4
Investors may be choosing small caps over emerging markets for their risk sleeve. Investors may have become uneasy over emerging markets due to geopolitical tensions (the Turkish lira crisis, instability in Venezuela, and Russian sanctions, for example), a rising 10-year Treasury yield, and a firmer dollar that has rallied from its February low. The risk sleeves of portfolios may have tilted toward small caps.
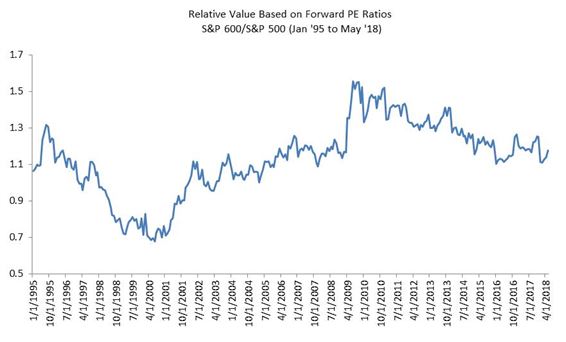
Small-cap valuation has become more attractive. Some see better value in small caps as the price-to-earnings (P/E) ratio has compressed on the S&P SmallCap 600, suggesting that small caps have cheapened in recent years. On a forward earnings basis, the S&P SmallCap 600 is currently trading at 20.1 compared to 17.0 for the S&P 500. The ratio of 1.18 is down from a peak of over 1.33 in July 2009.5
The technical picture is supportive. Using technical analysis can be a risky proposition, but the technical set up of the S&P SmallCap 600 looks bullish, in my view. The index has broken out of consolidation to the upside in a near textbook ascending triangle. The target of the triangle projects over 1075 based on the depth of the formation (this measure is approximate – this is an art not an exact science). Another target would be the top of a channel formed off the lows of the triangle. This is a moving target, but higher than current levels and consistent with the 1075 level. However, the small-cap sector appears to be overbought in the near term given the Relative Strength Index was recently over 73, but pullbacks to the hold highs in the 980 area may have the potential to provide support. Old resistance levels tend to become supportive (the top of the triangle).
1 Source: Bloomberg L.P.
2 Source: S&P Dow Jones Indices, “ How Global are the S&P 500, the S&P Midcap 400, and the S&P Smallcap 600 Style Indices?” Feb 28, 2018.
3 Source: Bloomberg, L.P. as of May 24, 2018
4 Source: IHS Markit
5 Source: Bloomberg, L.P. as of May 31, 2018
The posts on this blog are opinions, not advice. Please read our Disclaimers.