Get Indexology® Blog updates via email.

In This List

Carbon Pricing: The Business Case for Low-Carbon Innovation

Why Does Sequence of Returns Risk Matter for Retirement?

The Trump Rally – Or Is That Global Sector Diversification?

Commodities: A Deeper Dive Into the Five Potential Sources of Return

A Quick Primer on Benchmark Regulation

Carbon Pricing: The Business Case for Low-Carbon Innovation

Contributor Image
Rochelle March

Senior Analyst

Trucost, part of S&P Dow Jones Indices

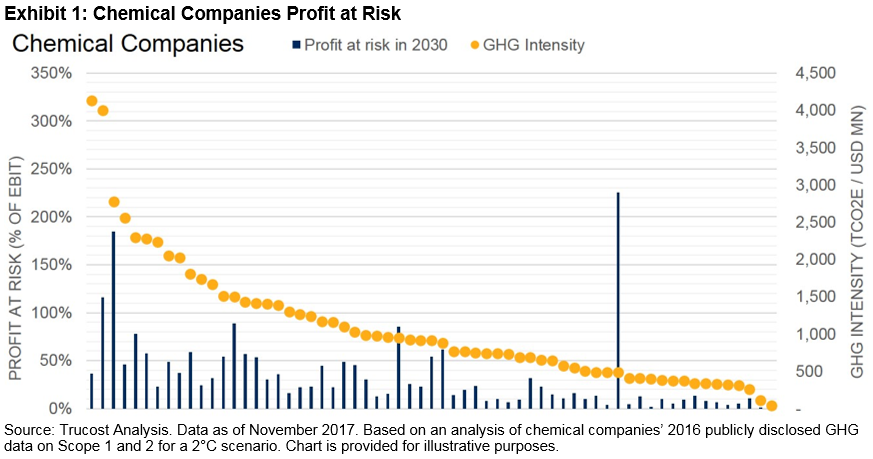
The belief that economic growth is possible without lowering carbon emissions is becoming harder to sell by the minute. A study by the London School of Economics showed that if business-as-usual emissions continue over this century, the value of risk to global financial assets in today’s terms is 1.8%, or USD 2.5 trillion. Likewise, analysis by Trucost shows that operating margins will turn negative for 46% of companies in the chemicals sector by 2030 because emitting carbon will become too expensive (see Exhibit 1).

Clearly, carbon pricing risk—the monetary value that accounts for the future costs of climate change regulation and transition—is likely to be a financially material issue. But addressing carbon risk also creates potential business opportunities.

In August 2017, Trucost launched its Corporate Carbon Pricing Tool to provide a data-led way for companies to translate carbon risk into financial terms. Here’s how carbon pricing can be applied to prove the business case for low-carbon innovation.

  • Calculating return on investment (ROI) for low-carbon investments: Sustainability managers need to provide their CFOs with a compelling business case for low-carbon investments. While investment in a diesel fleet versus an electric one may currently have a higher ROI, when factoring in carbon pricing risk, the ROI changes—especially over the lifecycle of the investment. By integrating a risk-adjusted carbon price into investment decisions and showing how future profits are at stake, the business case for low-carbon investment strengthens.

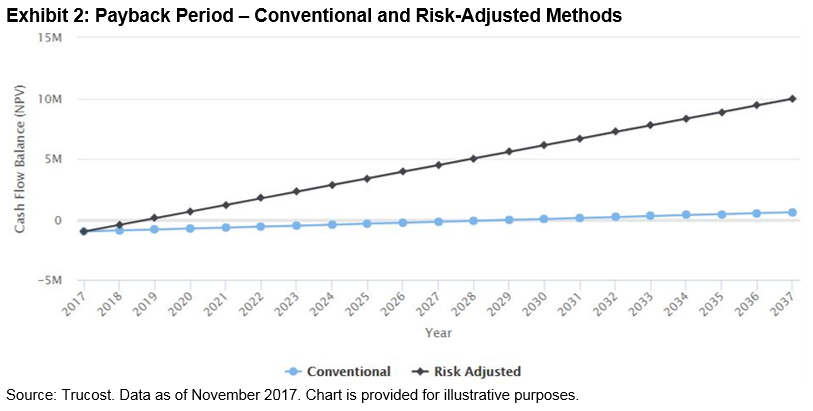
When using the risk-adjusted carbon price, a USD 1 million investment project has a payback period of less than two years and is already providing positive cash flow by the second year, while a conventional payback period would take almost 13 years.

  • Informing decision-making: To address carbon pricing, companies will need to either absorb the costs, pass them through to customers, or invest in low-carbon initiatives. To weigh these different options, companies can run their emissions and financial data through the Corporate Carbon Pricing Tool to determine which to prioritize.
  • Tailoring investments by region: Some regions have higher carbon pricing risk than others based on current emission schemes. By including this geographic factor, businesses are strategizing how to mitigate the risk, either by relocating their operations to less risky regions or by making low-carbon investments in preferred locations.
  • Benchmarking competitiveness against rival firms: Companies are benchmarking against peers to determine how they compare. If a competitor is leading, it may be able to pass fewer costs to consumers and charge lower prices. This directs companies to figure out why peers are more efficient. Is it location alone or because they are investing in energy-efficient technology?
  • Engaging individual business units to hit targets: Companies say that by communicating the carbon intensity of specific business units, each unit knows how much it needs to hit its target and contribute to a company’s reduction goal. Not only does this support company-wide engagement, it also helps raise internal funds for pilot projects and investments, like Unilever has done.
  • Communicating to investors: Companies increasingly agree that disclosing a carbon price to investors demonstrates a company is taking responsibility for future risks and has the managerial prowess to deliver on climate risk reduction. Increasingly, investors expect companies to report climate-related disclosures by applying scenario analysis, including a 2°C scenario. Additionally, a recent report by S&P Dow Jones Indices showed that low-carbon versions of the S&P 500 and S&P Global 1200 have actually outperformed their benchmarks in the past five years.

Pricing carbon risk provides a strategic link between environmental and financial performance, strengthening the business case for proactively mitigating climate-related risks. Companies and investors that take this step will benefit from a forward lens on carbon risk and the opportunity to inform tomorrow’s low-carbon innovation.

The posts on this blog are opinions, not advice. Please read our Disclaimers.

Why Does Sequence of Returns Risk Matter for Retirement?

Contributor Image
Peter Tsui

Former Director, Global Research & Design

S&P Dow Jones Indices

Sequence of returns (SoR) risk refers to the situation when the market experiences random movements in such a way that returns are not uniformly distributed. For example, in the 32-year period from 1966 to 1997, the DJIA had an annualized return of 8%. However, the returns were not evenly distributed over time. For the first half of this period, from 1966 to 1981, the Dow began at 1,000 and ended at about the same level. Then, from 1982 through 1997, the Dow grew over 15% per year, taking the index from 1,000 to about 8,000.

In a recent book “Adaptive Asset Allocation: Dynamic Global Portfolios to Profit in Good Times—and Bad,” by Adam Butler, Michael Philbrick, and Rodrigo Gordillo,[1] the authors looked at the DJIA history from 1966 to 1997 and performed an interesting thought experiment.

They divided the period into two halves: 1966-1981 and 1982-1997. For a retiree who retired in 1966, according to the historical order of the returns, they stipulated an initial portfolio balance of USD 3 million and monthly spending of USD 16,200, on an inflation-adjusted basis. Based on this withdrawal strategy, in 12 short years, by 1978, the money was gone. They then reversed the order of the sequence of returns as follows: the strongly surging market from 1982 to 1997 first, followed by the volatile sideways market from 1966 to 1981. In this scenario, the retiree was able to withdraw the desired income each year, adjusted for inflation, and still end up with over roughly USD 6 million in terminal wealth at the end of 1997.

This thought experiment illustrates the benefit of having a period of good returns early in one’s retirement; whereas, in the opposite case, when one experiences a period of bad returns later in one’s retirement, it may result in financial ruin.

For retirees who began their retirement shortly before years of major market corrections, such as the market crash in 1987 and the Great Recession of 2008, their retirement funds may be gravely affected, due to the exposure to downside risk. To help mitigate SoR risk, particularly given that no one can foretell the timing of adverse market events, it would be prudent to allocate a few years’ worth of spending needs in non-volatile accounts, specifically earmarked for the first few years in one’s retirement, in order to avoid SoR risk.

[1]   Adam Butler, M. Philbrick, R. Gordillo, Adaptive Asset Allocation: Dynamic Global Portfolios to Profit in Good Times – and Bad, 2016. John Wiley & Sons, Inc.: Hoboken, New Jersey.

The posts on this blog are opinions, not advice. Please read our Disclaimers.

The Trump Rally – Or Is That Global Sector Diversification?

Contributor Image
Phillip Brzenk

Managing Director, Global Head of Multi-Asset Indices

S&P Dow Jones Indices

This is the final post in our blog series that examines the domestic large-cap equity market performance, as represented by the S&P 500®, since the 2016 U.S. election.[1] We use the geographic revenue exposure of S&P 500 constituents to better understand whether or not Trump’s proposed U.S.-centric economic policies have had an impact on the equity market. In our last two posts, we looked at the performance of the Domestic Revenue and the Foreign Revenue Portfolios, as well as their macroeconomic risk exposures. This post investigates the sector-level performances of the Domestic and Foreign Revenue Portfolios.

The 11 sectors in the S&P 500 widely vary in their overall percent of total revenue obtained from the U.S. Sectors with relatively high revenue exposure to the U.S. (compared to the overall S&P 500 average) include financials, real estate, telecommunication services, and utilities, while information technology and materials tend to be more exposed to the global economy. Exhibit 1 shows the average percentage of revenue coming from the U.S. at the sector level and for the overall S&P 500 on Election Day.

Given that the constituents of the aforementioned revenue portfolios are selected based on their percent of revenue exposure, one could infer that the sector tilts of each portfolio reflect the S&P 500 revenue exposure composition. Observing the sector weights of the Domestic Revenue and Foreign Revenue Portfolios compared to the S&P 500 on Election Day confirms this (see Exhibit 2). For example, Exhibit 1 shows that the average company in the information technology sector received 47% of its revenue from the U.S., which is substantially lower than the overall S&P 500 company average (70%). Unsurprisingly, there was a significant overweight to the information technology sector in the Foreign Revenue Portfolio (active weight of 15.12%), while the Domestic Revenue Portfolio showed minimal exposure (active weight of -19.76%).

So, are the performance differentials between the two portfolios that we presented in the first post a result of tilting the S&P 500 sectors? To determine if this is the case, a sector attribution analysis was run for the time period (Nov. 8, 2016–Oct. 31, 2017). Attribution analysis breaks out the performance differences between each portfolio and the S&P 500 into an allocation effect and a selection effect. The allocation effect shows the impact of the active sector bets in the portfolios, while the selection effect demonstrates the impact of security selection within each sector.

Several conclusions can be made from Exhibit 3. First, the Foreign Revenue Portfolio benefited from sector bets and stock selection; however the majority of the excess return versus the S&P 500 came from the selection effect. This illustrates that leveraging geographic revenue data to tilt sector weights and select individual securities contributed to the positive alpha of the portfolio. Secondly, the resulting underperformance of the Domestic Revenue Portfolio came from the attribution and selection effects in near equal proportion.

The analysis provided in this blog series demonstrates that allocating toward the sectors or industries that were expected to benefit from “Trumponomics” would not have been rewarding in relative performance terms. In fact, the opposite has been true. Perhaps due to the absence of implementation of any of the proposed policies, confidence in any of them becoming reality has deteriorated in the marketplace.[2] Instead of claiming the last 12 months to be the Trump Rally (self-proclaimed,[3][4] or otherwise), maybe it can be called the “Multinational Corporations Rally.”

[1]   See first post here: https://www.indexologyblog.com/2017/11/08/the-trump-rally-one-year-later/
See second post here: https://www.indexologyblog.com/2017/11/13/the-trump-rally-a-macroeconomic-perspective/

[2]   In the October 2017 World Economic Outlook report, The International Monetary Fund revised GDP Growth projections for the U.S. in 2017 and 2018 downward from their April 2017 report, specifically due to significant uncertainty of the proposed economic policies, such as tax cuts, actually taking effect: https://www.imf.org/en/Publications/WEO/Issues/2017/09/19/world-economic-outlook-october-2017

[3]   https://twitter.com/realDonaldTrump/status/927847349648609280 and https://twitter.com/realDonaldTrump/status/927847471321141249

[4]   https://twitter.com/realDonaldTrump/status/926789876556500992

The posts on this blog are opinions, not advice. Please read our Disclaimers.

Commodities: A Deeper Dive Into the Five Potential Sources of Return

Contributor Image
Marya Alsati

Former Product Manager, Commodities, Home Prices, and Real Assets

S&P Dow Jones Indices

In a prior post, we listed five components of returns that commodities futures can provide. In this post, we will delve deeper into each component.

Insurance risk premium, according to Keynes’s theory, is earned when a market participant rolls their futures position and the price of the next futures contract is discounted against market expectations of the future spot price. A producer would enter into a short position (sell) in the futures market by offering a price that is lower than the expected price of the good at the delivery date, the holder of the long (buyer) position in the contract would profit from the producer’s potential loss, and the producer would accept this potential “loss” for a guaranteed price for the product. This is also why the volatility of the spot price is high when inventory is low.

Collateralization, or collateral return, is important because there is a low correlation between the nominal level of short-term interest rates and the spot return from commodities prices, so the collateral return provides diversification to the overall return achieved by market participants. In addition, this return tends to increase in periods of high inflation as central banks raise short-term rates, hence collateral return provides a form of inflation hedging.

Convenience yield, which is the implied return on inventories or “additional payment” that a commodity producer is willing to pay for the needed raw material, is to ensure this input is available in a timely manner to avoid delays or disruptions in production. Convenience yield is positive when the price of a commodity increases from a shortage (or inaccessibility to a commodity, like what happens to oil prices with geo-political risk), which provides a premium for the convenience of having the commodity when needed.

Convenience yield varies depending on the type of commodity, as commodities have different costs of storage, as well as the ability to produce more or less of a certain commodity during shorter time horizons. For example, an oil driller’s ability to produce oil after a fire that shuts down a certain refinery differs from a cocoa producer with drought-damaged crops. Some commodities are also interchangeable; for example, while cocoa has no replaceable counterpart, soybean oil can be easily replaced by palm or canola oil.

Expectational variance, historically, has had more positive than negative incidence in the commodity market, because a shock caused by a shortage due to a drought or a pipe burst is more likely to occur than a demand-side shock, or a sudden drop in demand, similar to what happened in the cattle industry during the mad cow disease period in the mid to late 1990s.

Expectational variance can provide diversification benefits because the price changes are driven by commodity-specific drivers that are completely independent from capital markets and other commodities.

Rebalancing, or roll return, is the difference in the price of the expiring contract and the next eligible contract. Futures contracts expire on a regular basis, and futures-based indices must roll their positions into the next contract to maintain their exposure.

If a commodity’s forward price curve is downward sloping (in backwardation), then the roll process involves rolling into (buying) a futures contract that is trading cheaper than the current futures contract. However, if the commodity’s forward price curve is downward sloping (in contango), then the roll process would involve rolling into a futures contract that is trading at a higher price than the current futures contract.

If the futures in the index are in backwardation regularly over time, and if the incidence of backwardation is higher relative to the degree of contango, then market participants tracking the indices will tend to profit from the roll process.

The posts on this blog are opinions, not advice. Please read our Disclaimers.

A Quick Primer on Benchmark Regulation

Contributor Image
Jamie Farmer

Former Chief Commercial Officer

S&P Dow Jones Indices

What Is It?

The Benchmark Regulation (BMR) is a key part of the European Union’s (EU’s) response to the LIBOR scandal and the allegations of similar manipulation of foreign exchange and commodity benchmarks.  It is intended to protect investors by requiring greater transparency and stronger governance among firms that: 1) provide, 2) contribute to, or 3) use a wide range of interest rate, currency, securities, commodity, and other indices or reference prices.

Why Does It Matter?

The BMR is extensive in scope and impact because of the wide use of benchmarks throughout the EU.  Benchmarks are common reference values and performance measures for exchange-traded and conventional funds, structured notes, options, swaps, forwards, and other instruments.

Where and to Whom Does It Apply?

The BMR applies to the “use of a benchmark within the Union”[1] and to EU-based firms that are benchmark users, administrators, and contributors.  Further, the BMR applies to benchmarks used in the EU but provided by administrators located outside of the EU; S&P Dow Jones Indices would be such an example.

  • Users: In general, those that issue financial instruments (as defined in Section C of Annex I of MiFID2) or issuers of investment funds (UCITS/AIFs) tracking the return of an index or that use indices to determine the amount payable under an investment fund.
  • Administrators: Publishers of benchmarks and/or indices.
  • Contributors: Those supplying inputs necessary for the calculation of benchmarks and/or indices (other than regulated or other readily available data).

To be clear, the BMR does not place any requirements on those investing in financial products.  Rather, it is germane to those publishing, contributing to, or issuing financial products based on benchmarks.

When Is It Effective?

The BMR actually builds upon the Final Report of the Board of the International Organization of Securities Commissions (IOSCO) for Principles for Financial Benchmarks dated July 2013 (IOSCO Principles).  Since their introduction four years ago, S&P DJI has annually certified its adherence to those principles.  The BMR—which now creates formal legal requirements, as distinguished from the best practices or principles prescribed by IOSCO—will apply starting Jan. 1, 2018.[2]  There is a transition period[3] and the use obligations will be phased in.

How Does the BMR Affect S&P Dow Jones Indices?

As noted, even though we are a U.S.-based administrator, S&P Dow Jones Indices will fall under the BMR since our benchmarks are used within the EU.  This, despite the fact that the impetus for this framework (the aforementioned scandals) dealt with benchmarks far removed in nature, governance, and calculation from those calculated by S&P DJI.

An equivalence decision (that is, a decision by the EU Commission that a third country—e.g., the U.S.—has laws equivalent to the BMR) is unlikely.  We are therefore seeking to ensure the continued use of our indices in the EU through one of the two other available routes: recognition (meaning a national competent authority acknowledges that a third country administrator meets the requirements of the BMR by reference to its compliance with the IOSCO Principles) or endorsement (meaning a national competent authority acknowledges that an index provided by a third country administrator meets the requirements of the BMR by reference to its compliance with the IOSCO Principles).  Our team is working closely with EU policy makers and regulators and we expect to fully comply with the BMR framework.

In fact, we have long believed that publishers of indices and benchmarks must ensure a strict separation between commercial and benchmark calculation functions.  The potential for conflicts naturally arises when an organization publishes indices as well as prices components and/or issues investment products.

S&P DJI focuses on index publication and does not engage in investment banking, equity listing, investment management, or trading.  Similarly, we do not price index components or issue investment products; we source component prices from third parties, such as regulated exchanges, and we license our indices to third-party product issuers.  Such separation of index publication from other steps in the investment product development cycle ensures transparency, independence, and objectivity.

At S&P DJI, physical and organizational firewalls separate commercial and governance operations.  Final decisions about methodologies, index constituents, index rebalancing, etc. are all made within a distinct group with no relation to and restricted communications with commercial operations.  Changes in constituents and weights are governed by objective, rules-based, and publicly available methodologies found at https://www.spindices.com/.

Transparency is one of the most broadly accepted and valued tenets of index-based investing.  It is incumbent on all participants to ensure that benefit persists.

[1] Article 2.1 BMR

[2] Article 59 BMR

[3] Article 51 BMR

The posts on this blog are opinions, not advice. Please read our Disclaimers.