Get Indexology® Blog updates via email.

In This List

The Investment Opportunity in China’s “New Era”

Commodities: Five Potential Sources of Return

Socially Responsible Investing in India

Why Mixing Media With Telecom Grows Communication

How Low Can Volatility Go?

The Investment Opportunity in China’s “New Era”

Contributor Image
Vania Pang

Capital Markets and Investment Solutions, Index and Quantitative Investment

ICBC Credit Suisse Asset Management (International) Company Limited

The 19th Party Congress of China, one of the most important political events in China this year, has cemented President Xi Jinping’s position as one of the most powerful leaders in decades. His name and political ideology are enshrined in the party constitution, known as “Xi Jinping’s Thought on Socialism with Chinese Characteristics for a New Era”. A long-term economic roadmap of the country has been set in the congress for the new era.

What does “New Era” mean to equity investors?

President Xi emphasized the following in the congress that will guide the policy making by the Party over the next few years.

1. To pursue “quality” economic growth

Growth target no longer being emphasized and specified in the Party’s work report. President Xi outlined a long-term roadmap for building a prosperous, strong, democratic, culturally advanced, harmonious and beautiful China by the mid-21st century.[1]  He reiterated the government’s commitment to transitioning the economy from a high growth model to a more sustainable and high-quality development model.

2. Rebalancing of resources allocation

The principal contradiction facing Chinese society now is a tension between “people’s ever-growing needs for a better life” and “unbalanced and inadequate development”. Rebalancing of resources allocation is the key to resolve the problem. Deepening of structural and supply-side reforms become the highest priority, while pushing for a market economy could achieve better resources allocation through market guidance.

Regarding improvement on productivity, emphasis on innovation, cutting excess capacity, advancement and utilization of information technology, moving up the value chain in manufacturing and services were announced.[2]

3. “Belt and Road” initiative

Rebalancing of regional development through initiatives such as One-Belt-One-Road could increase the economic activities and investment in the middle and western part of China where the GDP and income level are far lagged behind the coastal regions.

4. To build a “Beautiful China”

The emphasis on building a “beautiful China” shows that the policy makers will focus more on environmental protection and provide more support to green industry. The Ministry of Industry and Information Technology (MIIT) recently announced that China aims to increase boost the output of advanced environmental protection equipment to 1 trillion RMB by 2020. MIIT says the government will provide more financial support to boost green manufacturing and technology innovation.[3]

How to capture the investment opportunity in the “New Era”?

The key leadership reshuffle showed that President Xi has a tightened grip on power, which may enable the government to push economic reforms further in the next 5 years.

We expect mixed ownership SOE reform and supply-side reform will continue to be carried out in old economy sectors like commodity, materials, oil & gas, electricity and chemicals. Higher operation efficiency and improved profits could be achieved. Banking and finance sector could benefit from strengthening the implementation of policy regarding deleveraging and direct finance to private sectors. The “Belt and Road” initiative and rural development are the key focus of the government and could boost the demand for infrastructure and construction materials.

For the new economy, such as consumer, advanced manufacturing could be benefited from consumption and industrial upgrade, while information technology and health care sectors could be boosted by government’s support to R&D and innovation. The determination of building a “Beautiful China” by the government would encourage the investment in green industry such as renewable energy, environmental protection equipment and electrical vehicle.

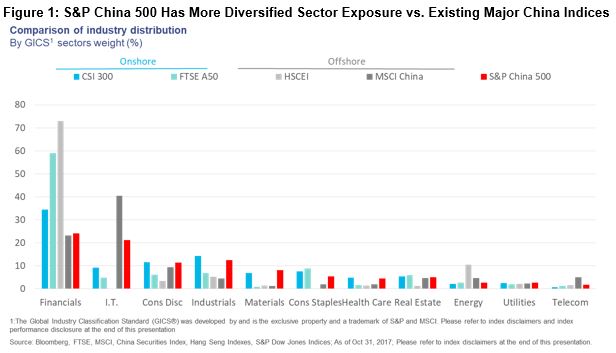
The diversified and all-inclusive S&P China 500 Index solution reflects the investment opportunity in both the old and new economy in one-click (Figure 1). For the year, the index has been performing strongly with YTD return of 39.64% (as of Oct 31, 2017).

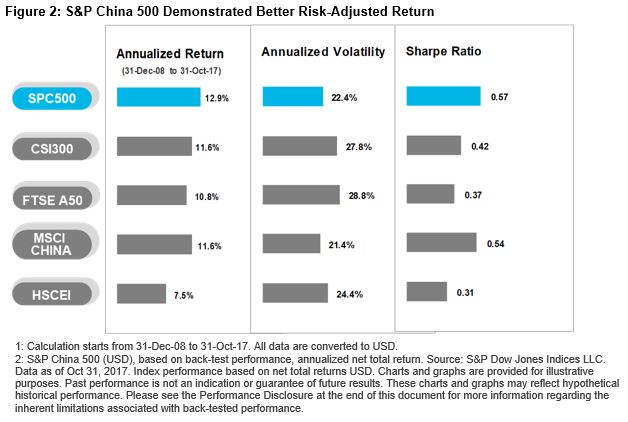
Benefited from its diversification in markets and sectors exposure, S&P China 500 has demonstrated better risk-adjusted returns (Figure 2). During the period from 31 Dec, 2008 to 31 Oct, 2017, the S&P China 500 generated an annualized return of 12.9% and Sharpe ratio of 0.57, both are the highest among the major China indices.

[1] China Daily. Oct 19, 2017. https://www.chinadaily.com.cn/china/2017-10/19/content_33428169.htm

[2] People.cn. Oct 19, 2017. http://cpc.people.com.cn/19th/n1/2017/1019/c414305-29595277.html

[3] Reuters. Oct 25, 2017. https://www.reuters.com/article/us-china-environment-equipment/china-urges-green-equipment-thrust-to-check-pollution-idUSKBN1CU17X

DISCLAIMERS
The S&P China 500 Index is a product of S&P Dow Jones Indices LLC and/or its affiliates and has been licensed for use by ICBC Credit Suisse Asset Management (International) Co., Ltd. (ICBCCSI), © 2017 S&P Dow Jones Indices LLC, a division of S&P Global. All rights reserved.  S&P and S&P 500 are registered trademarks of Standard & Poor’s Financial Services LLC, a division of S&P Global (“S&P”). DOW JONES is a registered trademark of Dow Jones Trademark Holdings LLC (“Dow Jones”). These trademarks together with others have been licensed to S&P Dow Jones Indices LLC. Redistribution, reproduction and/or photocopying in whole or in part are prohibited without written permission. This document does not constitute an offer of services in jurisdictions where S&P Dow Jones Indices LLC, Dow Jones, S&P or their respective affiliates (collectively “S&P Dow Jones Indices”) do not have the necessary licenses. All information provided by S&P Dow Jones Indices is impersonal and not tailored to the needs of any person, entity or group of persons. S&P Dow Jones Indices receives compensation in connection with licensing its indices to third parties. Past performance of an index is not a guarantee of future results. Neither S&P Dow Jones Indices LLC, Dow Jones, S&P, and their respective affiliates (“S&P Dow Jones Indices”) nor their third party licensors make any representation or warranty, express or implied, as to the ability of any index to accurately represent the asset class or market sector that it purports to represent and neither S&P Dow Jones Indices nor their third party licensors shall have any liability for any errors, omissions, or interruptions of any index or the data included therein.
In this document, ICBC Credit Suisse refers to ICBC Credit Suisse Asset Management Company Limited and its subsidiary, ICBC Credit Suisse Asset Management (International) Company Limited (“ICBCCSI”). ICBCCSI is a regulated entity under the Hong Kong Securities and Futures Commission.
No account has been taken of any person’s investment objectives, financial situation or particular needs when preparing this document. This is not an offer to buy or sell, or a solicitation or incitement of offer to buy or sell, any particular security, strategy, investment product or services nor does this constitute investment advice or recommendation.
The views and opinions expressed in this document, which are subject to change without notice, are those of S&P Dow Jones Indices LLC, ICBC Credit Suisse and/or its affiliated companies at the time of publication. While S&P Dow Jones Indices LLC, ICBC Credit Suisse and/or its affiliated companies (collectively as “we” or “us”) believe that the information is correct at the date of this presentation, no warranty of representation is given to this effect and no responsibility can be accepted by us to any intermediaries or end users for any action taken on the basis of this information. Some of the information contained herein including any expression of opinion or forecast has been obtained from or is based on sources believed by us to be reliable as at the date it is made, but is not guaranteed and we do not warrant nor do we accept liability as to adequacy, accuracy, reliability or completeness of such information.  The information is given on the understanding that any person who acts upon it or otherwise changes his or her position in reliance thereon does so entirely at his or her own risk without liability on our part.
This material has not been reviewed by the Hong Kong Securities and Futures Commission.  Issuer of this material: ICBC Credit Suisse Asset Management (International) Company Limited. This material shall be distributed in countries where it is permitted.
INDEX PERFORMANCE DISCLOSURE
The S&P China 500 was launched on August 28, 2015. All information presented prior to an index’s Launch Date is hypothetical (back-tested), not actual performance. The back-test calculations are based on the same methodology that was in effect on the index Launch Date. Complete index methodology details are available at www.spdji.com. Please read S&P Dow Jones Indices LLC’s DISCLAIMERS.

The posts on this blog are opinions, not advice. Please read our Disclaimers.

Commodities: Five Potential Sources of Return

Contributor Image
Marya Alsati

Former Product Manager, Commodities, Home Prices, and Real Assets

S&P Dow Jones Indices

Market participants have historically invested in commodity futures-based indices for their inflation protection and diversification benefits, given their low correlation to stocks and bonds. However, the returns earned from investing in commodities differ from those earned from traditional asset classes, in that commodities have no expected book value or expected cash flow, while a commodities’ value comes from the fact that they are consumable (like grains) or transformable (like petroleum) assets.

Physical commodities may be accessed through the cash spot market, but storage is costly and difficult.  Natural gas, for example, is expensive to store and to transport since it has to be maintained in liquid form at sub-zero temperatures.  Metals tend not to deteriorate over time, whereas grains and livestock do.  Gold is costly to store because it requires expensive security.

Investing in commodities indices that are constructed using long or short positions in futures on physical commodities whose value is determined based on the price of the underlying physical commodity plus yield and that trade on public markets that provide adequate liquidity and transparency, with negligible costs and no storage deterioration risk, offer a practical method to gaining commodities exposure and can provide a means for market participants to access the five components of the returns of the asset class.

So what are the five, generally accepted[1] components of returns in the commodities futures market?

The first is the insurance risk premium, which stems from the fact that producers of goods for public consumption (such as coffee, base metals, and petroleum), as well as the producers of these raw materials, wish to transfer the risk of price fluctuations to speculators, which in most cases are financial institutions.

The second is collateralization, since investment in commodities futures requires an initial margin, which is a small amount of cash that is calculated as a percentage of the notional amount of the commodity; fully collateralized versions are known as total return indices.

The third component is the convenience yield, which is the implied return on inventories and is regarded as the additional payment a commodity producer is willing to pay for the necessary raw material to ensure this input is available in a timely manner, in order to avoid delays or disruptions in production.

The fourth component is expectational variance, which is caused by unexpected inflation (supply-side shocks such as shortages) that results in sudden spikes in the price of a commodity.

The fifth component is rebalancing or roll return.  The roll return is the difference in the price of the expiring contract and the next eligible contract.  Futures contracts expire on a regular basis, generally monthly or quarterly.  Futures-based indices must roll their long (or short position) into the next contract to maintain their exposure.

[1]  Robert J. Greer, The Nature of Commodity Index Returns, The Journal of Alternative Investments, Summer 2000 and Calude V. Erb and Campbell Harvey, The Strategic and Tactical Value of Commodity Futures, Financial Analysts Journal, Volume 62, Number 2, 2006.

The posts on this blog are opinions, not advice. Please read our Disclaimers.

Socially Responsible Investing in India

Contributor Image
Ved Malla

Associate Director, Client Coverage

S&P Dow Jones Indices

In recent years, socially responsible investing has gained importance among market participants worldwide.  Globally, there has been an increase in the number of large-scale market participants who have become socially conscious and want to allocate their investments toward businesses that acknowledge the relevance of environmental, social, and governance (ESG) factors.

Socially responsible investing in India is at a nascent stage, but it is evolving and is expected to gain momentum in coming years.  Many stakeholders, including governments, corporations, and market participants, have become more conscious of this concept and are looking to integrate ESG aspects of businesses in their mainstream investment strategies.

In India, S&P BSE Indices has three indices in the sustainability space.

  1. S&P BSE 100 ESG Index: This index is designed to measure securities that meet sustainability investing criteria on ESG aspects while maintaining a risk and performance profile similar to the S&P BSE 100.
  2. S&P BSE CARBONEX: This index is designed to measure performance of the companies within the S&P BSE 100 based on their commitment to mitigating risks arising from climate change.
  3. S&P BSE GREENEX: This index is designed to measure the performance of the top 25 “green” companies in the S&P BSE 100 in terms of greenhouse gas emissions.

Exhibits 1 and 2 showcase the three-year performance returns and the risk/return profiles of the three previously mentioned indices and compare them with the S&P BSE 100, which is the benchmark for the three sustainability indices, and the S&P BSE SENSEX, which is India’s headline index.

Exhibit 1: Performance of the S&P BSE 100 ESG Index, S&P BSE CARBONEX, S&P BSE GREENEX, S&P BSE 100, and S&P BSE SENSEX

Source: S&P Dow Jones Indices LLC.  Data from Oct. 31, 2014, to Oct. 31, 2017.  Index performance is based on total return in INR.  Past performance is no guarantee of future results.  Chart is provided for illustrative purposes and reflects hypothetical historical performance.  The S&P BSE 100 ESG Index was launched on Oct. 26, 2017.

Exhibit 2: Risk/Return Characteristics of the S&P BSE 100 ESG, S&P BSE CARBONEX, S&P BSE GREENEX, S&P BSE 100, and S&P BSE SENSEX
YEAR S&P BSE 100 ESG INDEX S&P BSE CARBONEX S&P BSE GREENEX S&P BSE 100 S&P BSE SENSEX
ABSOLUTE RETURN (%)
3-Year 34.89 34.03 23.99 33.83 24.28
ANNUALIZED RETURN (CAGR) (%)
1-Year 22.55 22.44 13.44 22.32 20.47
2-Year 17.08 16.60 12.12 16.25 13.17
3-Year 10.49 10.25 7.43 10.20 7.51
RISK (%)
1-Year 13.55 11.95 12.76 12.15 11.67
2-Year 14.97 14.33 14.27 14.37 13.80
3-Year 13.95 13.75 13.87 13.80 13.53
RISK-ADJUSTED RETURN
1-Year 1.66 1.88 1.05 1.84 1.75
2-Year 1.14 1.16 0.85 1.13 0.95
3-Year 0.75 0.75 0.54 0.74 0.56

Source: S&P Dow Jones Indices LLC.  Data from Oct. 31, 2014 to Oct. 31, 2017.  Past performance is no guarantee of future results.  Table is provided for illustrative purposes and reflects hypothetical historical performance.  The S&P BSE 100 ESG Index was launched on Oct. 26, 2017.

From Exhibits 1 and 2, we can see that the S&P BSE 100 ESG and S&P BSE CARBONEX outperformed the S&P BSE SENSEX and S&P BSE 100 over the period studied.  The three-year absolute return of the S&P BSE 100 ESG and S&P BSE CARBONEX was 34.89% and 34.03%, respectively, while that of the S&P BSE SENSEX and S&P BSE 100 was 24.28% and 33.83%, respectively.

The three sustainability indices cover all of the 11 GICS® sectors.  Exhibit 3 lists the sector breakdown with weightages of the three sustainability indices.

Exhibit 3: Sector Breakdown of the S&P BSE 100 ESG Index, S&P BSE CARBONEX, and S&P BSE GREENEX

Source: S&P Dow Jones Indices LLC.  Data from Oct. 31, 2014, to Oct. 31, 2017.  Past performance is no guarantee of future results.  Chart is provided for illustrative purposes and reflects hypothetical historical performance.  The S&P BSE 100 ESG Index was launched on Oct. 26, 2017.

We can see that the financials sector had the highest weight in the three indices, while real estate had the lowest weight (see Exhibit 3).

Socially responsible investing in India is slowly but surely gaining importance, as there has been a paradigm shift in the investment strategy adopted by market participants.  Market participants have now started to give importance to ESG aspects while assessing companies’ long-term strategy for wealth creation.  Many market participants now believe that the long-term financial sustainability and value creation of a company is dependent on how a company manages its ESG aspects in the long run.

The posts on this blog are opinions, not advice. Please read our Disclaimers.

Why Mixing Media With Telecom Grows Communication

Contributor Image
Jodie Gunzberg

Former Managing Director, Head of U.S. Equities

S&P Dow Jones Indices

The means by which we communicate has grown over the past several years as a result of integration between telecommunications, media, and internet companies.  In response, S&P Dow Jones Indices and MSCI recently announced the expansion of the Telecommunications Services Sector into a new Communication Services Sector to be implemented after the close on Friday, September 28, 2018.  While the companies involved are not announced yet, there are some important things to know about how the changes may impact the indices.

As mentioned in the announcement, in order to include companies that facilitate communication and offer related content and information through various media, selected companies from the Consumer Discretionary Sector currently classified under the Media Industry Group and Internet & Direct Marketing Retail Sub-Industry along with certain companies currently classified in the Information Technology Sector, will be added to the existing Telecommunication Services Sector.

To start, here is what the Telecommunication Services Sector looks like currently:

While it may look comprehensive, there are only 3 stocks from the S&P 500 in the Telecommunication Services Sector with a combined market capitalization of $413.0 billion and average market cap of $137.7 billion for a weight of just 1.9% in the broad index.  In the greater set of market cap weighted U.S. equity indices, the sector is still relatively small.

Source: S&P Dow Jones Indices. Stock count as of Nov. 15, 2017 and weights are as of Oct. 31, 2017.

The new Communication Services Sector will include the existing telecommunication services companies (as an Industry Group,) but also aims to reflect the integration of telecom, media and select internet companies, leading to an additional Industry Group called Media & Entertainment.  The companies that facilitate communication and offer related content and information through various mediums will be considered in the new sector, depicted below.

Source: S&P Dow Jones Indices. Please see definitions on Sub-Industries at the end of this note.

The expansion of the Telecommunication Services Sector into the new Communication Services Sector has the potential to add 16 new stocks in the S&P 500 from the current Media Industry Group with an average market cap $39.5 billion for a total market cap of $632.2 billion.  There are also 6 small caps with an average market cap of $1.2 billion and total market cap of $7.2 billion, as well as 8 mid cap stocks with an average market cap of $3.8 billion and total market cap of $30.4 billion from the Media Industry Group.  The Home Entertainment Software Sub-Industry will also add another 2 large caps totaling $82.0 billion and 1 mid cap stock worth $12.6 billion, with further possible additions from the Internet Software & Services Sub-Industry,  Internet & Direct Marketing Retail Sub-Industry and the Information Technology Sector.

Source: S&P Dow Jones Indices. As of Nov. 17, 2017.

Although no announcements have been made on the exact companies moving into the new sector yet, based on the information in the announcements, a hypothetical approximate of the new communication services sector can be examined.  In the following illustrations of hypothetical backtests, the approximation of a possible communication services sector index is based on 10 years of historical monthly data of the current Telecommunication Services Sector, Media Industry Group, Internet Software & Services Sub-Industry and the Home Entertainment Software Sub-Industry with fixed weights shown in the table above.  The S&P MidCap 400 Home Entertainment Software Sub-Industry is excluded from the analysis from insufficient history.

The results show the cumulative total returns of the hypothetical backtest of the new Communication Services Sector outperformed the Telecommunication Services Sector over the past 10 years in each of the large, small and mid cap indices.  Though the large caps of the new sector outperformed by 7.3% annualized and the mid caps outperformed 7.5% annualized, the small caps outperformed by 12.0% annualized.  The new small cap sector hypothetically would have returned a positive annualized return and the mid caps would have held up in the past year.

Source: S&P Dow Jones Indices. The Communication Services Sector shown is a hypothetical backtest.

In every time period measured annualized over 1, 3, 5 and 10 years, the new Communication Services Sector outperformed the Telecommunication Services Sector.   Not only did it outperform but the risk was also reduced over every time period, with the exception of the 10 year annualized risk for the large cap sector.  The added volatility comes from the relatively large weight and volatility from the S&P 500 Internet Software & Services Sub-Industry that overpowers the moderately low correlation.

Source: S&P Dow Jones Indices. The Communication Services Sector shown is a hypothetical backtest.

However, when examining the returns on an annual basis, the mid caps do not fare as well.  In the past 10 years, the S&P 400 Telecommunication Services Sector outperformed the hypothetical new mid cap Communication Services Sector six times.  Despite this, the new sector on average outperformed by 6.4% in a calendar year, mainly from strong outperformance in 2009 and 2017.   That said, the hypothetical new Communication Services Sector outperformed the current Telecommunication Services Sector 9 of 10 years in small caps and 7 of 10 years in large caps, with average outperformance of 11.8% and 11.9%, respectively.

Source: S&P Dow Jones Indices. The Communication Services Sector shown is a hypothetical backtest. 2017 is year-to-date through Nov. 17, 2017.

Overall, it seems the higher returns with lower volatility is an attractive result of the expansion of the current Telecommunication Services Sector into the new Communication Services Sector.  While the new sector will be more diversified with lower volatility, there is still room for diversification across the market capitalizations, but especially between large and small caps.

*New definitions for Sub-Industries:
Integrated Telecommunication Services: Operators of primarily fixed-line telecommunications networks and companies providing both wireless and fixed-line telecommunications services not classified elsewhere. Also includes Internet Service Providers offering internet access to end users.
Wireless Telecommunication Services: Providers of primarily cellular or wireless telecommunication services. New definition removes “including paging services.”
Publishing: Publishers of newspapers, magazines, and books in print or electronic formats. New definition removes “and providers of information.” Also, the current Publishing Sub-Industry is part of the Consumer Discretionary Sector, Media Industry Group and Media Industry.
Movies & Entertainment: Companies that engage in producing and selling entertainment products and services, including companies engaged in the production, distribution and screening of movies and television shows, producers and distributors of music, entertainment theaters and sports teams. Also includes companies offering and/or producing entertainment content streamed online. The current Movies & Entertainment Sub-Industry is part of the Consumer Discretionary Sector, Media Industry Group and Media Industry, but will move out of the Media Industry and into the Entertainment Industry.
Interactive Home Entertainment: Producers of interactive gaming products, including mobile gaming applications. Also includes educational software used primarily in the home. Excludes online gambling companies classified in the Casinos & Gaming Sub-Industry.  The current Home Entertainment Software Sub-Industry that is part of the Software Industry, Software & Services Industry Group and Information Technology Sector, will be included in the new Interactive Home Entertainment Sub-Industry.
Interactive Media & Services: Companies engaging in content and information creation or distribution through proprietary platforms, where revenues are derived primarily through pay-per-click advertisements. Includes search engines, social media and networking platforms, online classifieds, and online review companies. Excludes companies operating online marketplaces classified in Internet & Direct Marketing Retail.  Given the discontinuation of the current Internet Software & Services Sub-Industry and Industry in the Software & Services Industry Group and Information Technology Sector, and commonality in definition including “revenues from online advertising,” some of these companies may move into the new Interactive Media & Services Sub-Industry.

This was written by product management and based only on publicly announced data and not a product of GICS, IMPG or Index Governance.

The posts on this blog are opinions, not advice. Please read our Disclaimers.

How Low Can Volatility Go?

Contributor Image
Fei Mei Chan

Former Director, Core Product Management

S&P Dow Jones Indices

There’s still some time remaining in 2017, but if it goes the way the year has thus far, this will be the least volatile year for the S&P 500 in 22 years. Given this context, selection to the S&P 500® Low Volatility Index (an index of the 100 least volatile stocks in the S&P 500) recently has mostly been about which stocks have declined in volatility the most. In each of the last four rebalances, average realized volatility for the stocks in Low Vol has declined compared to the previous rebalance.

In the latest rebalance, Utilities regained its usual prominence, adding 5%; at 22% of Low Vol, it is currently the biggest sector in the index. This came mostly at the expense of Consumer Staples, whose weight declined to 9% from 13%. Real Estate’s weight doubled to 6%.  Curiously, although underweighted compared to the S&P 500, Technology maintains a significant weight in Low Vol (the sector’s standing ballooned in the rebalance in May 2017.)


As a rule of thumb, sector level volatility usually provides good insight into the S&P 500 Low Volatility Index, even though the index’s methodology is entirely focused at the stock level. For the latest rebalance, however, sectoral volatility was only part of the picture. For the year ended October 31, 2017, all sectors declined in volatility with the exception of Technology and Telecom. Unsurprisingly, Telecom has left Low Vol altogether.

Volatility at the sector level declined the most for Energy, but there was little change in Energy’s weight in Low Vol from the previous rebalance. Meanwhile, volatility at the sector level rose for Technology, yet there was also little change in its weight in Low Vol. This would suggest that there was a wide range of volatility within both sectors, and that stock selection was more meaningful than the sectoral effect.

The posts on this blog are opinions, not advice. Please read our Disclaimers.