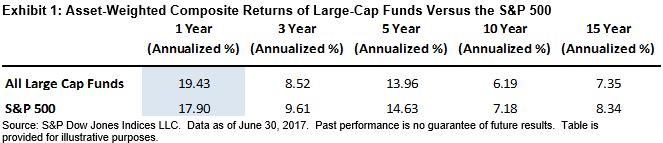
The SPIVA U.S. Mid-Year 2017 Scorecard shows that the relative performance of actively managed domestic equities funds across large-, mid-, and small-cap segments has improved in recent months. For example, only 56.56% of large-cap equity managers underperformed the S&P 500® for the one-year period, whereas 84.62% underperformed the benchmark at mid-year 2016.[1] More importantly, when measured on an asset-weighted basis using all the share classes in the large-cap universe, the one-year composite return of active large-cap managers (19.43%) actually outpaced the S&P 500 return (17.90%), leading to an excess return of 1.53% (see Exhibit 1).
Large-cap equity is an asset class that is typically considered to be highly efficient and has historically been difficult for active managers to outperform. The asset-weighted composite of large-cap active managers outperforming the benchmark over the one-year period has led us to closely examine the sources of (or detractors from) active returns. Using the holding of actively managed large-cap funds, we look at the traditional sources of long-only active management alpha—sector allocation decisions, security selection, and factor bets—to conduct the performance attribution analysis.
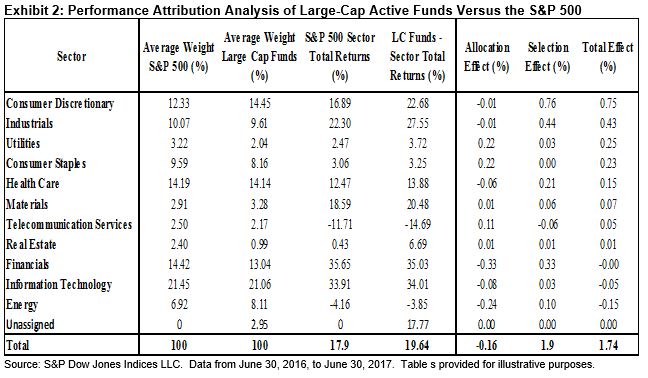
Allocation effect – the decision to overweight and underweight outperforming sectors relative to the benchmark—is a key component of active managers’ value proposition. To determine allocation effect, we compare the average weight in each of the 11 GICS® sectors held by active large-cap managers relative to the S&P 500 during the measurement period, and the sector contribution to benchmark return as well as the portfolio return.[2]
Over the one-year period, information technology was the largest and best-performing sector in the S&P 500, thereby making it the biggest contributor to benchmark return. It is almost too convenient to assume that improvement in the relative performance of large-cap active managers stems from overweighting that sector. However, the data shows that, on average, large-cap managers have been maintaining neutral to slight underweight relative to the S&P 500 in information technology (see Exhibit 2). In fact, the slight underweight in the sector has detracted from managers’ excess returns, as shown by the negative allocation and total effects.
Moreover, in the five sectors that contributed the most to the benchmark returns, large-cap active managers had higher returns than the benchmark, indicating that stock selection skills were at work. An attribution analysis confirmed that in fact most of the excess return came from selection effect,[3] in which active managers demonstrated their ability to pick winning stocks within each sector. The 1.74% excess return over the S&P 500[4] came exclusively from stock selection, given that the allocation effect was slightly negative.
In a follow-up blog, we will provide additional framework through which active factor bets taken by large-cap active managers are evaluated. Similar to the sector attribution analysis, we will use the holdings of large-cap active managers to decompose their risk factor exposures relative the S&P 500. Together, this series of blogs allow us to better understand the drivers behind the improvement in relative performance of large-cap managers over the past year.
[1] The SPIVA methodology calls for the inclusion of the largest share class per fund in the universe to avoid double counting.
[2] The relationship is mathematically expressed as Allocation Effect = ![]() , where W = average weight, p = aggregated average large-cap portfolio, b = benchmark, R = returns, and i = selected sector or grouping.
, where W = average weight, p = aggregated average large-cap portfolio, b = benchmark, R = returns, and i = selected sector or grouping.
[3] The relationship can be mathematically expressed as Selection Effect = ![]() . We assume that managers are basing their security selection process from the ground up, and therefore we grouped the interaction effect part of the attribution together with the selection effect.
. We assume that managers are basing their security selection process from the ground up, and therefore we grouped the interaction effect part of the attribution together with the selection effect.
[4] It should be noted that the attribution analysis is conducted from the ground up using the holdings, and the effects are compounded daily; the excess return from the attribution analysis of 1.74% differs from the composi te level excess return of 1.53%.
The posts on this blog are opinions, not advice. Please read our Disclaimers.