Get Indexology® Blog updates via email.

In This List

If the Performance Doesn’t Get You, the Taxes Might

Will Low-Carbon Trends in the U.S. Continue?

S&P BSE SENSEX Index Series

Why Energy May Halt This Commodity Rally

Q&A: What is factor investing?

If the Performance Doesn’t Get You, the Taxes Might

Contributor Image
Michael Mell

Global Head of Custom Indices

S&P Dow Jones Indices

Assets are shifting from active to passive: “investors pulled $23 billion out of actively managed U.S. equity funds, extending the group’s streak of outflows to 33 consecutive months.  During 2016, passive fund strategies in the United States took in a record $504.8 billion.”[1]  In response to this, an elegant point has been made “that the average investment manager does not outpace the market over meaningful time horizons.  However, a fairly simple fact has gotten lost in the debate.  Simply put, not all investment managers are average”[2] and that the way to find these managers is by screening for low-cost active funds and managers who are participating in the funds they run.  Thus an active approach can add value by beating its benchmark when costs are reasonable and the manager’s incentives are aligned with fund those of the fund’s participants.

You Forgot About My Taxes!

Understanding that past performance does not guarantee future results, it is possible that one day active management may prove its value beyond a select population of low-cost and self-invested fund managers.  However, “passive management, as many studies have demonstrated, almost always wins out in the long term—both because it’s inherently more tax effective and because it’s less costly,”[3] and while not every active manager is average and many do offer low cost solutions, the impact of taxes is another factor that must be considered in the analysis. It’s important to note “on an after-tax basis, managers of stock funds for large- and mid-sized companies produced lower returns than their index-style competitors 97% of the time, while managers of small-cap stocks trailed 77% of the time.”[4]  Furthermore, “taxes knocked an average of 0.96 percentage point a year off the returns of about 2,000 actively managed U.S. stock mutual funds over the 15 years ended in September 2014, if they were held in taxable accounts rather than tax-sheltered retirement plans, according to research by Vanguard Group. By contrast, taxes reduced the returns of 130 broad-based U.S. stock index funds by an average of 0.69 percentage point a year over the same period—about one third less.”[5]

You Can’t Keep Going!

Financial advisor Steven Lockshin reviewed S&P DJI’s December 2016  Persistence Scorecard as it pertains to active management and noted that:

  • Relatively few funds can stay at the top. Out of 631 domestic equity funds that were in the top quartile as of September 2014, only 2.85% managed to stay in the top quartile at the end of September 2016.  Furthermore, 2.46% of the large-cap funds, 2.20% of the mid-cap funds, and 3.36% of the small-cap funds remained in the top quartile;
  • The figures are equally unfavorable when viewed over longer-term investment horizons. Over the five-year period, 91.91% of large-cap managers, 87.87% of mid-cap managers, and 97.58% of small-cap managers lagged their respective benchmarks;
  • Similarly, over the 10-year investment horizon, 85.36% of large-cap managers, 91.27% of mid-cap managers, and 90.75% of small-cap managers failed to outperform on a relative basis.[6]

This is important because when one participates in an active mutual fund, the statistical odds of continued outperformance against the benchmark are not high.  When taxes are factored into the analysis, the picture arguably becomes more compelling for the use of passive strategies.

Taxes Are Not Just an Issue for Active Mutual Funds

Beyond the tax issue for active mutual funds, “taxpayers should beware that as IRAs increase in size, so does the potential for taxes on these accounts if they have investments in alternative assets such as hedge funds, private-equity funds, limited partnership, operating businesses and real-estate.”[7]  So if hedge funds or private equity funds seem appealing, just remember their tax costs could be significant, even in an IRA.

The Bottom Line

The bottom line when considering active versus passive investing is if the performance of an active strategy does not get you, the taxes might.

[1]   https://corporate.morningstar.com/US/documents/AssetFlows/AssetFlowsJan2017.pdf

[2]   https://www.americanfunds.com/individual/insights/active-management/adding-our-voice-indexing.html

[3]   Steven Lockshin, http://www.iris.xyz/network/active-investments-lot-hope-dangerous

[4]“             Active vs. Passive Investing: Which Approach Offers Better Returns?” http://executiveeducation.wharton.upenn.edu/thought-leadership/wharton-wealth-management-initiative/wmi-thought-leadership/active-vs-passive-investing-which-approach-offers-better-returns

[5]   Laura Saunders, https://www.wsj.com/articles/how-passive-funds-trim-your-tax-bill-1476968401

[6]   Steven Lockshin, http://www.iris.xyz/network/active-investments-lot-hope-dangerous

[7] Laura Saunders, https://www.wsj.com/articles/are-taxes-lurking-in-your-tax-free-retirement-account-1489141814

The posts on this blog are opinions, not advice. Please read our Disclaimers.

Will Low-Carbon Trends in the U.S. Continue?

Contributor Image
Emily Ulrich

Former Senior Product Manager, ESG Indices

S&P Dow Jones Indices

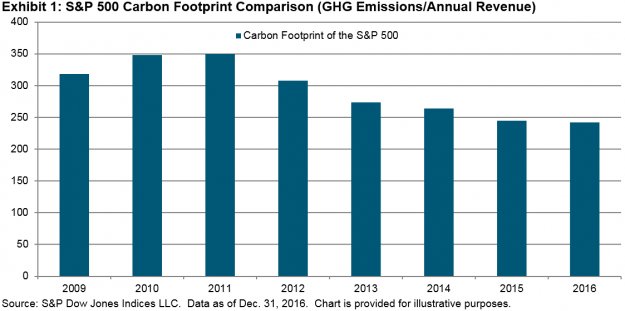
When people think of a low-carbon economy, the U.S. may not be the first one to come to mind.  In almost all things ESG, Europe is considered the leader.  However, the U.S. market has made some strides in recent years.  The carbon footprint of the S&P 500® has actually been declining since 2011, as illustrated in Exhibit 1.

This is good news for ESG market participants, although this decline has also started to stagnate, signaling that the low-carbon economy in the U.S. is at a critical point, with two possible outcomes.

On one hand, the head of the Environmental Protection Agency (EPA) recently questioned the role of carbon dioxide as a harmful pollutant—portending the potential future policy changes by the EPA.[1]  To put this in to context, back in 2007, the Supreme Court ruled that carbon dioxide was an air pollutant and that under the Clean Air Act, the EPA was all but required to regulate carbon dioxide, unless they were able to provide scientific evidence that greenhouse gases (GHGs) were not harmful.[2]  The recent statement questioning the link between carbon and climate change makes it look like the EPA may be leaning toward the latter part, and therefore attempting to deregulate the carbon economies—a concern for those focused on socially responsible investing.

On the other hand, while the change in EPA policy may be disheartening, it’s clear that the global markets feel differently.  This new stance signals a widely different viewpoint than most other countries around the globe.  In November 2016, delegates from 197 countries met in Marrakesh for COP 22, an annual climate change conference designed to reduce the production of GHGs.  This was a follow up to COP 21 in 2015, where these same countries (including the U.S.) met and signed the Paris Agreement, with the goal of preventing global temperatures from rising more than 2˚C above pre-industrial times.

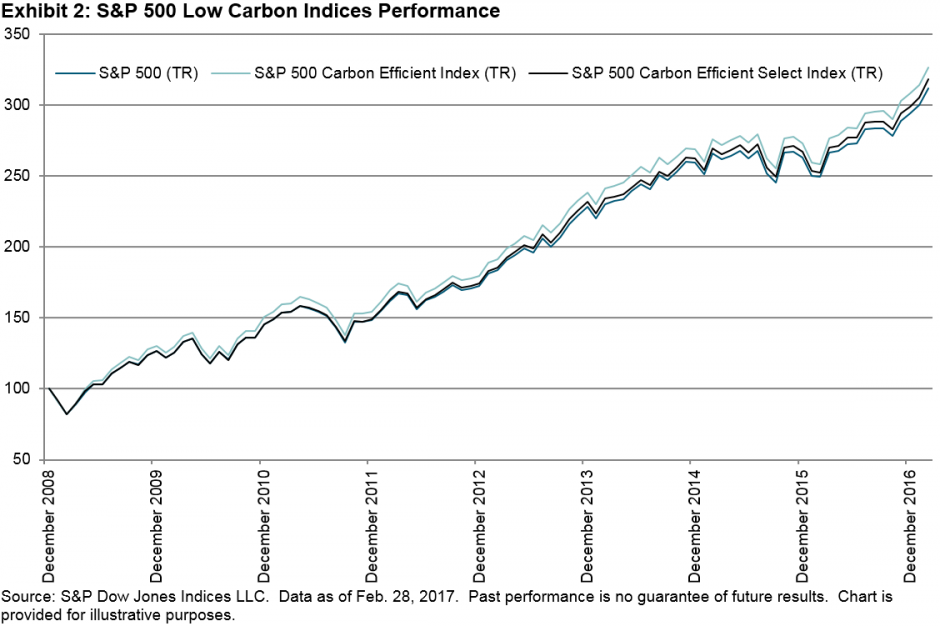
In addition, market participant interest is increasingly focused on low carbon, particularly as those indices outperform the benchmark.  As illustrated by Exhibit 2, the S&P 500 Carbon Efficient Index and the S&P 500 Carbon Efficient Select Index have continued to outperform the benchmark (ever so slightly).

While public policy may no longer be implementing environmental regulation, market participant interest may be the driving force behind carbon reductions in the U.S.  We can expect that the world will continue to try to offset the damage done by GHGs—regardless of policy in the U.S.—and these efforts are likely to continue to affect financial markets, where interest in ESG investing continues to grow.

[1] http://www.reuters.com/article/us-usa-epa-pruitt-idUSKBN16G1XX

[2] http://www.nytimes.com/2007/04/03/washington/03scotus.html

The posts on this blog are opinions, not advice. Please read our Disclaimers.

S&P BSE SENSEX Index Series

Contributor Image
Mahavir Kaswa

Former Associate Director, Product Management

S&P BSE Indices

The S&P BSE SENSEX is India’s bellwether index and is a globally recognized benchmark.  With the recent launch of the S&P BSE SENSEX 50 and S&P BSE SENSEX Next 50, Asia Index Pvt. Ltd. has expanded its S&P BSE SENSEX Index Series.  The newly launched indices are designed to measure the top 50 companies and the next set of 50 companies after the top 50 in the Indian market, respectively. Like other S&P BSE Indices, both adopt rules-based, transparent, and objective index methodologies.

Constituents are selected from the top 100 companies based on float-adjusted market cap and stringent liquidity filters.  The top 50 companies form the S&P BSE SENSEX 50, while remaining 50 companies from the pool form the S&P BSE SENSEX Next 50.

All three indices are diversified by BSE sectors, which reflect the respective weights of the sectors in the Indian market.  The key differences between these indices are number of companies covered and sector/size coverage. Finance and Information Technology are two largest BSE Sectors in S&P BSE SENSEX and S&P BSE SENSEX 50 indices; however Basic Materials and Finance are the two largest sectors in S&P BSE SENSEX Next 50 index. S&P BSE SESENSEX and S&P BSE SENSEX 50 covers nearly 52% and 65% of free float market capitalization of S&P BSE AllCap index respectively.

All three indices are designed to be investable, and their methodologies require stringent liquidity filters. The indices are weighted by float-adjusted market cap, similar to the methodology used by other index providers globally.  In order to keep index composition current and relevant to the market, the indices undergo rebalancing semiannually, in June and December.

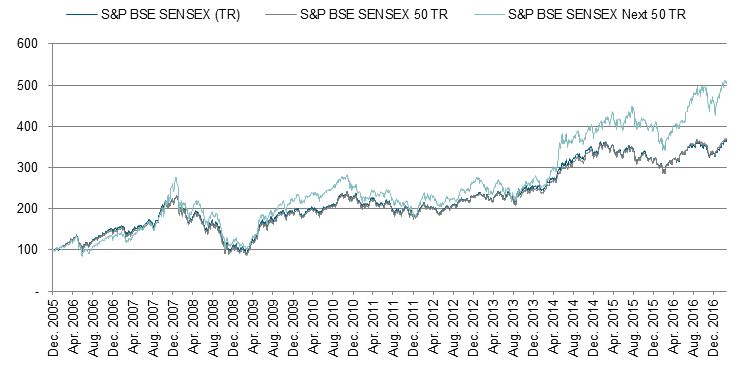
Let’s look at the performance of each of them.

Exhibit 1: Performance of S&P BSE SENSEX Indices

Source: Asia Index Private Limited and S&P Dow Jones Indices LLC.  Data as of March 6, 2017.  Past performance is no guarantee of future results.  Chart is provided for illustrative purposes and reflects hypothetical historical performance.  The S&P BSE SENSEX 50 was launched on Dec. 6, 2016.  The S&P BSE SENSEX Next 50 was launched on Feb. 27, 2017.

Exhibit 2: Risk/Return Characteristics of S&P BSE SENSEX Indices
STATISTICS PERIOD S&P BSE SENSEX S&P BSE SENSEX 50 S&P BSE SENSEX NEXT 50
Absolute Returns YTD 9.2% 9.8% 14.1%
Annualized Returns (CAGR) 1 Year 19.67% 21.68% 37.43%
5 Year 12.81% 13.26% 17.89%
10 Year 10.20% 10.73% 15.50%
Annualized Volatility 1 Year 12.34% 12.38% 16.50%
5 Year 14.89% 14.88% 18.56%
10 Year 23.63% 23.55% 24.07%

Source: Asia Index Private Limited and S&P Dow Jones Indices LLC.  Data as of March 6, 2017.  Past performance is no guarantee of future results.  Table is provided for illustrative purposes and reflects hypothetical historical performance.  The S&P BSE SENSEX 50 was launched on Dec. 6, 2016.  The S&P BSE SENSEX Next 50 was launched on Feb. 27, 2017.

Since nearly 80% of S&P BSE SENSEX 50’s index weight overlaps with constituents of the S&P BSE SENSEX, the risk/return characteristics of the indices are similar.  The S&P BSE SENSEX Next 50 has a unique set of 50 companies, with nearly 55% of the index weight coming from mid-cap stocks, and it has shown consistently higher total returns than the other indices, with marginally higher volatility.

Exhibit 3: Sector and Size Composition
BSE SECTOR S&P BSE SENSEX S&P BSE SENSEX 50 S&P BSE SENSEX NEXT 50
Basic Materials (%) 1.2 2.7 23.8
Consumer Discretionary (%) 10.0 11.9 7.0
Energy (%) 11.3 11.2 7.4
Fast Moving Consumer Goods (%) 10.8 9.9 13.9
Finance (%) 31.4 32.5 19.9
Healthcare (%) 6.6 5.8 9.2
Industrials (%) 8.9 7.5 11.2
Information Technology (%) 13.9 13.4 1.3
Telecom (%) 1.8 1.9 2.8
Utilities (%) 4.1 3.2 3.5
Total (%) 100.0 100.0 100.0
BSE SIZE
LargeCap (%) 100.0 99.2 45.0
MidCap (%) 0.0 0.8 55.0
Total (%) 100.0 100.0 100.0

Source: Asia Index Private Limited.  Total returns and volatility as of March 6, 2017.  Past performance is no guarantee of future results.  Table is provided for illustrative purposes and reflects hypothetical historical performance.  The S&P BSE SENSEX 50 was launched on Dec. 6, 2016.  The S&P BSE SENSEX Next 50 was launched on Feb. 27, 2017.

The posts on this blog are opinions, not advice. Please read our Disclaimers.

Why Energy May Halt This Commodity Rally

Contributor Image
Jodie Gunzberg

Former Managing Director, Head of U.S. Equities

S&P Dow Jones Indices

Although OPEC agreed to cut production to help support the oil price, they may have miscalculated their power as a cartel.  The U.S. producers are filling in the gap causing inventories to soar, and that has caused the S&P GSCI Crude Oil index to fall 9.4% this month. It is the biggest 9-day decline since the period ending Nov. 7, 2016, when OPEC raced to produce ahead of the planned supply cut implementation.

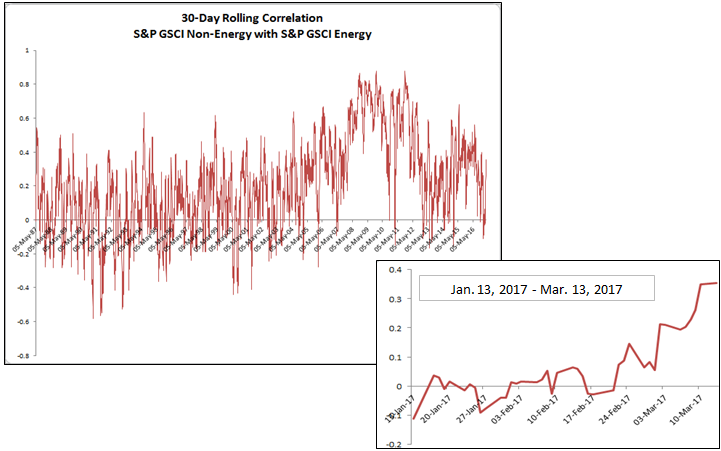
Generally there is a low correlation of 0.28 between non-energy and energy commodities, using daily data back to Jan. 2, 1987.  Recently, the correlation has been rising, and while not excessively high, the pace at which it is increasing is noticeable.  On Jan. 13, 2017, precisely two months ago, the 30-day correlation between the S&P GSCI Energy and S&P GSCI Non Energy was -0.11, increased to 0.05 by Mar. 1, and is now 0.35, going from uncorrelated to moderately correlated in a short time.

Source: S&P Dow Jones Indices.

Now there are 17 commodities besides crude oil that are negative month-to-date through March 13, 2017, that is the most down in a month with oil since Nov. 2015, when there were 21 down.  It is far worse than when oil was down in Jan. 2017 with only 9 other commodities.

Source: S&P Dow Jones Indices.

Finally, the commodities that usually hold up with oil declines are now crumbling.  Normally several of the agriculture and livestock (coffee, soybeans, wheat, live cattle, lean hogs and corn) do well on average when oil drops.  Historically, corn holds up best, gaining 56 basis points on average in months oil falls.  Further, none of the non-energy commodities typically lose more than 1% in an average month that oil loses, but now the losses are substantial with greater than 1% drops month-to-date in 12 of 13 non-energy commodities that are down with oil.

Source: S&P Dow Jones Indices.

Silver, live cattle and nickel are worst performing so far through March, 13, down 8.1%, 8.3% and 7.4%, respectively. Additionally, every sector is negative for the first time since Nov. 2015, including the industrial metals that were so promising have now fallen near 3% month-to-date in Mar. with only lead marginally positive, putting into question the optimism of growth that industrial metals (copper) are known for predicting,


The posts on this blog are opinions, not advice. Please read our Disclaimers.
Q&A: What is factor investing?

Contributor Image
Chris Doll

Vice President, Product & Business Strategy

PowerShares Canada

We recently hosted Tim Edwards, Senior Director, Index Investment Strategy at S&P Dow Jones Indices, for an in-depth discussion about factor-based investing and the role it can play in a diversified portfolio.

Chris: What is factor investing? What are the factors?

Tim: To be a factor, two things in particular need to be true. The first is that it needs to be a characteristic of stocks that explains the differences between returns.  For example, a company’s size can often help explain their performance.  Size is a factor.  The second characteristic of a factor is that it is something that can be measured and captured.  For example, whether a stock is going to outperform would be very useful to know, but we don’t know which ones will do that.  So, that is not a factor.  The term “factor investing” really means investing in portfolios specifically designed to capture certain factors.

Chris: Factor investing is rooted in decades of research. Can you talk about some of the better-known factors, those that have shown persistence as consistent drivers of returns?

Tim: In markets across the world, lower-risk stocks have historically shown an improved risk/return profile, which has led to a wealth of research on the “low volatility” factor.  Perhaps even more famously, the value factor has accumulated close to a century’s worth of research and study.  Two more factors that are very commonly looked at include size – small companies tend to outperform large companies – and momentum, which is the concept of identifiable trends within individual equities, relative to each other and to the market.

Chris: Why have certain factors provided better risk-adjusted returns historically and how is this likely to persist in the future?

Tim: The outperformance of a few factors, I would identify low volatility, value and momentum in particular, has been the source of much academic and practitioner debate.   The long-term outperformance from these factors is, of course, a challenge to the efficient market theories preferred by academics.  For investors, the more pertinent question is whether they have the right exposures to these factors, and if the historical pattern of outperformance will continue.

Chris: What has the evolution of indexing meant for investors trying to seek factor returns or capture factor returns?

Tim: A good few decades ago, offering market-like returns was a highly rewarded activity. In time, managers’ performance began to be increasingly compared to broader market benchmarks. Then those same benchmarks became investible, at a relatively low cost, via the first index funds. Other strategies in the purview of active management eventually followed: value, risk management or momentum strategies became widely available in indices. As time passed, it became increasingly apparent that the core patterns of returns that many funds were offering were systematically replicable through a market exposure and a few select factor tilts. I see it as something of a democratization process, in which these forms of investing are examined, systematized, indexed and eventually made available to investors through index-linked investment products, typically at a much lower cost and with greater transparency.

Chris: In your mind is factor investing a free lunch? Is there a way for investors to know when to rotate between factors to end up with a better result than the market?

Tim: I would caution against a belief that any one of these, or any one combination of these, will deliver persistent constant outperformance. There’s no magic recipe that gives you the perfect solution over every time period, each of these factors will ultimately be affected by the macro environment.  Having said that, there is obviously the opportunity for investors to either diversify or better calibrate their exposure to factors either with the goal of a long-term outperformance, or better navigating the current environment.

Click here to access the full interview.

The posts on this blog are opinions, not advice. Please read our Disclaimers.