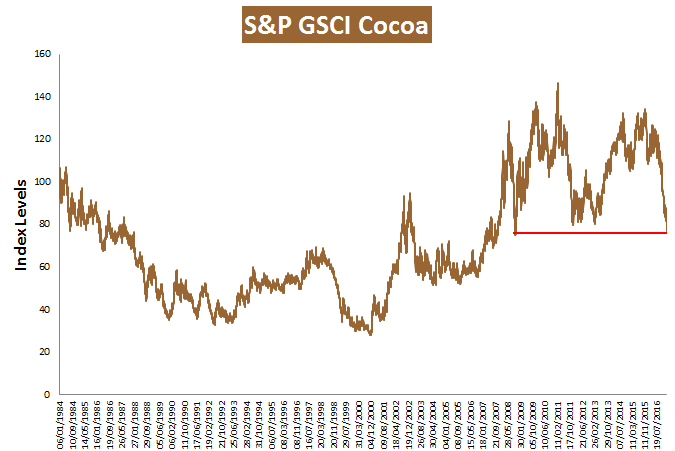
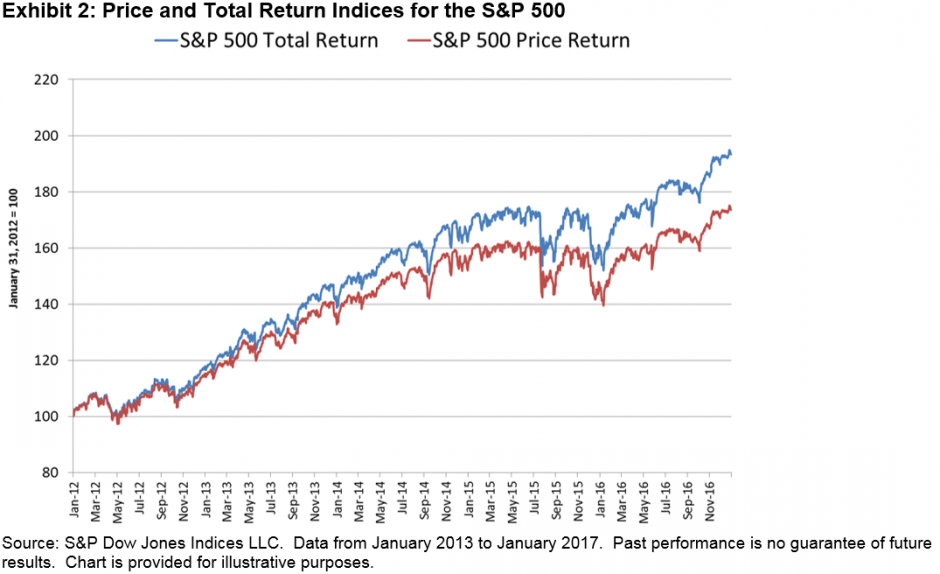
Why worry? New highs for the U.S. stock market indices will keep coming, right? Just in case, this might be a good time to examine asset classes that are not correlated to the equity market or the “uncorrelated”.
Corporate bonds of the issuers in the S&P 500 are tracked in the S&P 500 Bond Index. As a group they have seen a negative correlation to the equities market. Heavily composed of investment grade bonds the index has recorded a positive return of 0.65% year-to-date and a weighted average yield of 3.3%
Investment grade municipal bonds also historically have had negative correlations to the equities markets. The S&P National AMT-Free Municipal Bond Index has recorded a 0.72% total return year-to-date. These tax-exempt bonds have a weighted average yield of 2.31%.
Senior loans are higher in the capital market structure than unsecured high yield bonds and are also floating rate instruments. These characteristics help make them less correlated with the equities market as well as the fixed rate bond markets. The S&P/LSTA U.S. Leverage Loan 100 Index has recorded a positive return of 0.30% year-to-date. The floating rate senior loans tracked in this index have a weighted average yield to maturity of 4.76%.
High yield or “junk” bonds tend to be more highly correlated to equities due the their position in the capital market structure. As a result, junk bond and stock prices can at times move in the same direction based on the market’s perception of the companies strength or weakness. With a weighted average yield of 5.85% the S&P U.S. High Yield Corporate Bond Index the index is up 1.57% compared to the S&P 500 Index which is up 3.66% (total return).
Table 1: Select asset classes and their correlations to the S&P 500 Index:

The posts on this blog are opinions, not advice. Please read our Disclaimers.