Get Indexology® Blog updates via email.

In This List

Round Numbers and the Dow

Quality: A Driving Factor of Small-Cap Returns

The Little Engine That Could

Sukuk Market in 2016: Year in Review

ESG Investment – A Strategy for Long-Term Value Creation

Round Numbers and the Dow

Contributor Image
David Blitzer

Former Managing Director and Chairman of the Index Committee

S&P Dow Jones Indices

As the Dow Jones Industrial Average approaches the 20,000 level everyone seems to be suddenly fascinated with the figure. People who rarely ask if the market is up or down want to know if the Dow will cross this supposed benchmark today. Journalists   with years sent covering the markets want to know what 20,000 means.  But, if the Dow had started in 1895 instead of 1896 we would probably have passed 20,000 a year ago.

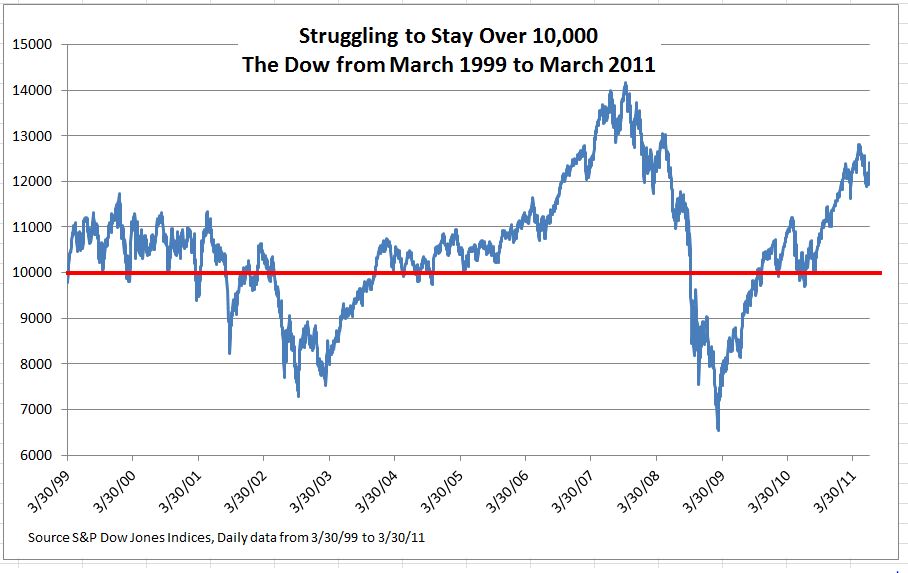
Before we all get too excited, we might remember what happened after the Dow crossed 10,000 for the first time in April, 1999 – it took two big falls back over the next 10 years. The chart shows the Dow from March 30, 1999 to June 30, 2011 with two nasty bear markets.

Psychological studies suggest that a round number is seen as more stable and solid than a more precise figure.  Saying the Dow closed 9,911.21 yesterday may be sound precise and accurate but certainly doesn’t hint have the positive attributes that people tend to associate with a large round number.  If you ignore the chart 20,000 might make you think the market isn’t about to drop. Round numbers may be used to describe products while more exact numbers slightly below a round number are popular for prices.  Prices of individual stocks tend to cluster near round numbers, probably because most people read numbers left to right and 19.90 sounds a lot cheaper than 20.00.  An investor will buy at 19.90 but hold at 20. Moreover, the scale matters: when markets in Europe switched to the euro from the former local currencies, these round number effects switched from the local currency to the euro.

For investors the level of the Dow or any index depends on an arbitrary base value — what really matters the percentage gain or loss over time.

The posts on this blog are opinions, not advice. Please read our Disclaimers.

Quality: A Driving Factor of Small-Cap Returns

Contributor Image
Aye Soe

Former Managing Director, Global Head of Core and Multi-Asset Product Management

S&P Dow Jones Indices

Much has been written about the performance differential between the two leading small-cap indices, the S&P SmallCap 600® and Russell 2000.  Over a long-term investment horizon, the S&P SmallCap 600 has outperformed the Russell 2000 with less risk.  Part of the performance differential can be attributed to the June Russell rebalancing effect.  As winners from the Russell 2000 graduate to the Russell 1000 and losers from the Russell 1000 move down to the small-cap index, fund managers are forced to sell winners and buy losers, thereby creating a negative momentum portfolio (Furey 2001).

We looked at the average monthly excess returns of the S&P SmallCap 600 over the Russell 2000 from January 1994 through Nov. 30, 2016, and grouped them by calendar months.  Average monthly excess returns for July are higher than any other month, and this is found to be statistically significant (see Exhibit 1).  It should be noted that July is the only calendar month to have a statistically significant t-Stat.

capture

In our recent research study, we showed that the June rebalancing effect only accounts for approximately one-half of the long-term excess returns (A Tale of Two Benchmarks).  Unlike the Russell 2000, the S&P SmallCap 600 requires companies to meet financial viability criteria to be eligible for inclusion.  The financial viability rule requires that the sum of the most recent four consecutive quarters’ as-reported earnings be positive, as well as the as-reported earnings of the most recent quarter.  This profitability measure can be considered as a proxy for quality.  Research has shown that higher-quality companies, on average, outperformed lower-quality companies over a long-term investment horizon.

Below, we show that profitability screening plays a role in driving the returns of the S&P SmallCap 600.  We tested a universe of U.S small-cap stocks[1] with a market cap between USD 200 million and USD 2 billion and divided the securities into two groups.[2]

  • Group 1 consisted of securities for which the sum of the most recent four consecutive quarters’ as-reported earnings and the most recent quarter EPS were positive.
  • Group 2 consisted of securities for which the sum of the most recent four consecutive quarters’ as-reported earnings and the most recent quarter EPS were not positive.

As shown in Exhibit 2, Group 1 outperformed Group 2 as well as the overall small-cap universe with lower volatility, resulting in a higher Sharpe ratio.  The positive information ratio of Group 1 also highlights that small-cap companies with profitability characteristics were able to generate higher excess returns over the benchmark (the small-cap universe in this case) on a consistent basis.  It is also worth noting that these companies had lower beta to the market as well.

capture

Our analysis shows that the profitability or quality factor plays a meaningful role in cross-sectional dispersion of small-cap stocks’ returns.  Companies with strong profitability measures outperformed those without during the back-tested period.  The live performance record of the small-cap indices can attest to the role of the quality factor as a key return driver among small-cap stocks, as the S&P SmallCap 600 has outperformed the Russell 2000 since inception and with lower volatility.[3]

[1]   10.72% versus 8.84% annualized return, 18.37% versus 19.24% annualized volatility, respectively.
[2]   The underlying universe is the S&P Total Market Index.
[3]   The testing period ran from January 1994 through November 2016, with the holding period assumption being 12-month portfolios weighted by market cap.  To avoid survivorship bias, the Compustat Research Inactive database was used to ensure that all currently inactive companies were included in the test universe.

The posts on this blog are opinions, not advice. Please read our Disclaimers.

The Little Engine That Could

Contributor Image
Philip Murphy

Former Managing Director, Global Head of Index Governance

S&P Dow Jones Indices

Since the U.S. presidential election, headlines touting small-cap performance have almost invariably cited the Russell 2000.  As impressive as that index’s return has been, S&P DJI has a little engine that persistently wins the small-cap race—the S&P SmallCap 600®.  Outperformance of the S&P SmallCap 600 versus the Russell 2000 primarily has to do with two factors: 1) the negative Russell reconstitution effect and 2) our little engine does not try pulling too many low-quality stocks up the hill.  It focuses on a manageable trainload of liquid, higher-quality names, staying clear of micro-caps that trade by appointment and other low-quality stocks.  In a future post, my colleague Aye Soe will discuss the quality effect in greater detail.

Like the S&P MidCap 400®, the S&P SmallCap 600 is governed by the same methodology as the S&P 500®.  Liquidity, free float, and financial viability criteria are identical for all three.  The only difference between their respective rules are the market cap guidelines for new entrants.  Currently, candidates for entry into the S&P SmallCap 600 must have a market cap between USD 400 million and USD 1.8 billion.  The Russell 2000 is not nearly as selective, relying on a mechanical market cap ranking to determine index constituency and extending far into micro-cap territory.

The structural differences between the S&P SmallCap 600 and Russell 2000 have resulted in favorable relative performance for the S&P SmallCap 600.  For example, if we look at the returns of the 16 trading days from election day (Nov. 8, 2016) through Nov. 30, 2016, the S&P SmallCap 600 finished ahead of the Russell 2000 by 1.2% (see Exhibit 1).

capture

Of course, 16 days is an insufficient period from which to draw any conclusions.  Still, in the long run, the S&P SmallCap 600 has historically outshined the Russell 2000—as well as most active small-cap managers (see Exhibit 2).

Exhibit 2: Annualized 10-Year Total Returns of Active Small-Cap Blend Mutual Fund Share Classes and Small-Cap Benchmarks

capture

The implications for small-cap market participants are straightforward.  First, indexing small-cap equities works very effectively.  Market participants, advisors, and fiduciaries may want to consider active fees in light of the historical evidence in favor of indexing.  The notion that it only works in more efficient market segments like large caps is a myth.  Second, the index one selects for access to certain investment spaces or for benchmarking active managers important matters (a lot).  Selecting the Russell 2000 historically resulted in: 1) less return per unit of risk than could have been achieved with the S&P SmallCap 600, or 2) a lower hurdle for expensive active managers to gain outsized fees—more often than not for underperformance.  In short, it is advisable to remember the Little Engine That Could when implementing small-cap exposure.

The posts on this blog are opinions, not advice. Please read our Disclaimers.

Sukuk Market in 2016: Year in Review

Contributor Image
Michele Leung

Former Director, Fixed Income Indices

S&P Dow Jones Indices

Global currency sukuk continued to expand in 2016. Increasing issuances were observed in U.S. dollar, Indonesian rupiah, and Pakistani rupee sukuk, though there were decreases in Malaysian ringgit and Bangladesh taka sukuk compared with last year.[1] The U.S. dollar and Malaysian ringgit sukuk continued to dominate the sukuk market.

The Dow Jones Sukuk Index, which seeks to track U.S. dollar-denominated, investment-grade sukuk, added 17 new sukuk with a total par amount of USD 13.5 billion into the index.  Sovereign sukuk continued to dominate the issuance, including USD 2.5 billion from Indonesia, USD 1.5 billion from Malaysia, USD 1 billion from Turkey, and USD 500 million from Oman.  The biggest corporate sukuk issuances were USD 1.5 billion from IDB Trust, USD 1.2 billion from DP World, and USD 1 billion from Emirates Islamic Bank.  Among all the new issuances, 33% was from the United Arab Emirates.

Looking at the overall country issuance in the Dow Jones Sukuk Index in Exhibit 1, Gulf Cooperation Countries (GCC) remained the largest contributor, at 57%.  For the non-GCC countries, the three biggest are Indonesia, at 15%, Malaysia, at 13%, and Turkey, at 10%.

Exhibit 1: Countries of Risk of the Dow Jones Sukuk Index

 20161209a

In terms of total return performance, the Dow Jones Sukuk Index rose 4.00% YTD as of Nov. 30, 2016 (see Exhibit 2).  The Dow Jones Sukuk Higher Quality Investment Grade Select Total Return Index, which seeks to track sukuk from specified countries of risk, gained 3.54% for the period.  The S&P MENA Sukuk Index, which is designed to measure sukuk issued in the Middle East and African market, advanced 3.97% in the same period.

Among the ratings-based subindices, the sukuk rated ‘BBB’ outperformed and rose 4.84% YTD, while the sukuk rated ‘AA’ also went up 4.43% in the same timeframe.  The longer-maturity indices performed better than the shorter-maturity ones, reversing the trend in 2015.  As of Nov.30, 2016, the Dow Jones Sukuk 5-7 Year Total Return Index and the Dow Jones Sukuk 7-10 Year Total Return Index gained 6.22% and 5.71% YTD, respectively.

Exhibit 2: Total Return Performance of the Dow Jones Sukuk Index Series

20161209b

[1] Source: Thomson Reuters Eikon. Data as of Nov 8, 2016.

The posts on this blog are opinions, not advice. Please read our Disclaimers.

ESG Investment – A Strategy for Long-Term Value Creation

Contributor Image
Ved Malla

Associate Director, Client Coverage

S&P Dow Jones Indices

In the past few years, there has been a paradigm shift in the investment strategy adopted by market participants, wherein they are shifting from a strategy of short-term gain to one of long-term value creation.  Traditionally, market participants have considered publically available records like balance sheets, income statements, and annual reports to analyze the long-term value proposition of companies.  However, they have started to give importance to environmental, social, and governance (ESG) aspects when assessing companies’ long-term strategy for wealth creation.  Globally, ESG factors are considered a mainstream investment strategy.  Market participants now believe that the long-term financial sustainability and value creation of a company are dependent on how a company manages its ESG aspects in the long run.

Let us now discuss the components of ESG individually.

  • Environmental criteria analyze companies based on their policy on green technologies, climate change, greenhouse gas emissions, renewable or alternate energy sources, waste management, pollution control, water management, natural resource conservation, deforestation, Risks associated with these environmental aspects are looked into, and the company’s management of these risks is assessed.
  • Social criteria look at company policies regarding social factors like consumer protection, human rights, working conditions, health and safety measures, employee relations and diversity, etc. The nature of the business is also considered, as many market participants avoid businesses involved in alcohol, tobacco products, gambling, pornography, military, weapons, fossil fuels, and other industries they may not consider socially acceptable.
  • Governance criteria look at transparency in accounting methods, board independence, bribery, corruption, political party donations, executive compensation, disclosures under various regulations, rights of minority shareholders, etc.

ESG investments have matured globally, and many fund managers are tracking various ESG indices like the S&P 500® ESG Index, S&P Global 1200 ESG Index, etc.  Passive fund managers use ETFs or structured products that track an ESG index.  On the other hand, active fund managers depend on ESG scores to make active investment bets.  S&P Dow Jones Indices has partnered with RobecoSAM, a global specialist in sustainability investing, to provide ESG scores.

ESG investing in India is a new concept.  Some banks have issued green bonds that have been well received by market participants.  In the equity space, S&P BSE Indices has two indices in the sustainable investment space—the S&P BSE CARBONEX and S&P BSE GREENEX.  Traditionally, Indian companies have poor ESG disclosures compared with their global peers.  In recent years, some global market participants have pulled their investment from Indian companies because they did not comply with the international ESG standard benchmark.  However, this is undergoing a change, and both corporates and market participants have started to accept the importance of ESG factors in doing business.

ESG investing in India is expected to evolve and align itself with global market trends.  This shift is expected to gain momentum in the next few years in India, and more market participants will likely integrate ESG aspects into mainstream investment decisions, with the ultimate goal of long-term value creation.

The posts on this blog are opinions, not advice. Please read our Disclaimers.