The spread between the returns of the S&P GIVI Japan and its benchmark index, the S&P Japan BMI, comes from three sources: the excess return of the S&P Low Beta Japan Index; the excess return of the S&P Intrinsic Value Weighted Japan Index; and a residual effect that comes from the sequential approach to the index’s construction. Looking at the low beta and value legs individually may help market participants to understand the performance of the S&P GIVI Japan better.
Performance
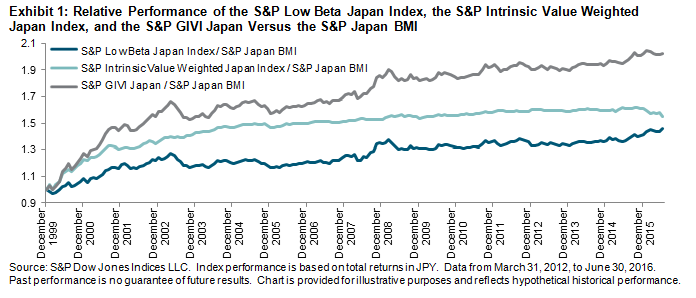
The S&P Low Beta Japan Index and the S&P Intrinsic Value Weighted Japan Index outperformed the S&P Japan BMI by 2.42% and 2.79%, respectively, over the period from Dec. 31, 1999, to June 30, 2016. Over that time period, however, there were cycles in the performance of the two legs and the correlation coefficient.
Exhibit 1 provides a visual illustration of the relative performance of the two legs versus the S&P Japan BMI. The value premium seems to be compressed in Japan over time. We see for the first time in June 2016 that the S&P Intrinsic Value Weighted Japan Index underperformed the S&P Japan BMI over a rolling five-year period. The low beta leg tended to outperform during down markets and underperform during up markets. In the bull markets from 2H 2012 to 1H 2015, however, the low beta leg had a counterintuitively strong performance. The low beta leg continued to do well when Japanese equity markets were down, starting from 2H 2015.
Please refer to S&P GIVI Japan and Major Single Factors from July 2016 for a performance analysis since the launch of the indices.
Correlation
Exhibit 2 shows the rolling three-year correlation coefficient between the two legs. The full period correlation coefficient between the two legs is 0.35. Over the seven-year period ending June 30, 2016, there seems to have been a much lower correlation (-0.15). Given the performance of these two legs since end of 2012, the correlation between them has declined dramatically. As of June 30, 2016, the correlation was at -0.54, the lowest level since the end of 1999.

Valuation
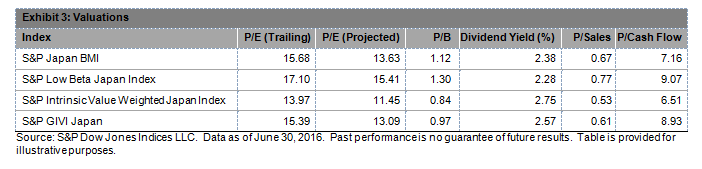
The recent performance also significantly pushed up the valuation of the S&P Low Beta Japan Index. As shown in Exhibit 3, the S&P Low Beta Japan Index was priced at 15.41x projected earnings and 1.30x book value as of June 30, 2016. This was much higher than the 13.63x and 1.12x, respectively, of the benchmark, the S&P Japan BMI. We should note that the valuation of the S&P GIVI Japan was still more favorable compared with the benchmark.