When analyzing Mexican fixed income indices during the summer (June 20 to September 20), we have seen trends over the past 15 years. We know that through the years, economic and momentum factors are not the same, and what happened in Mexico last year can’t be compared with what happened 10 years ago. Instead, let’s focus on how the annualized returns of some fixed income indices have behaved historically during this period of the year.
Exhibit 1 shows the indices analyzed and their reference numbers, and Exhibit 2 shows the results.
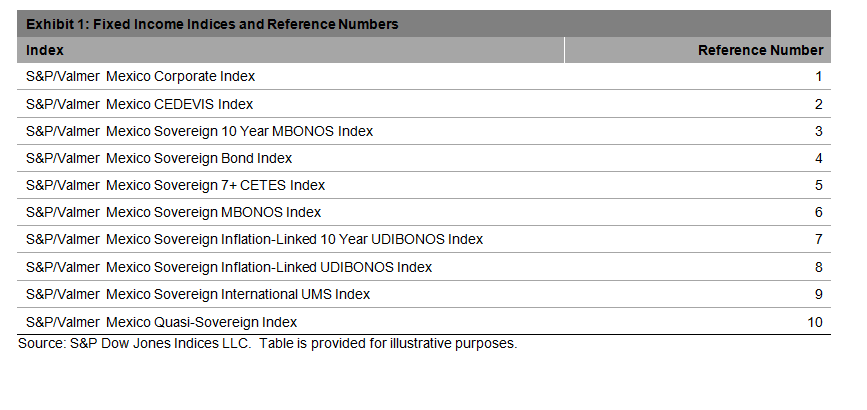
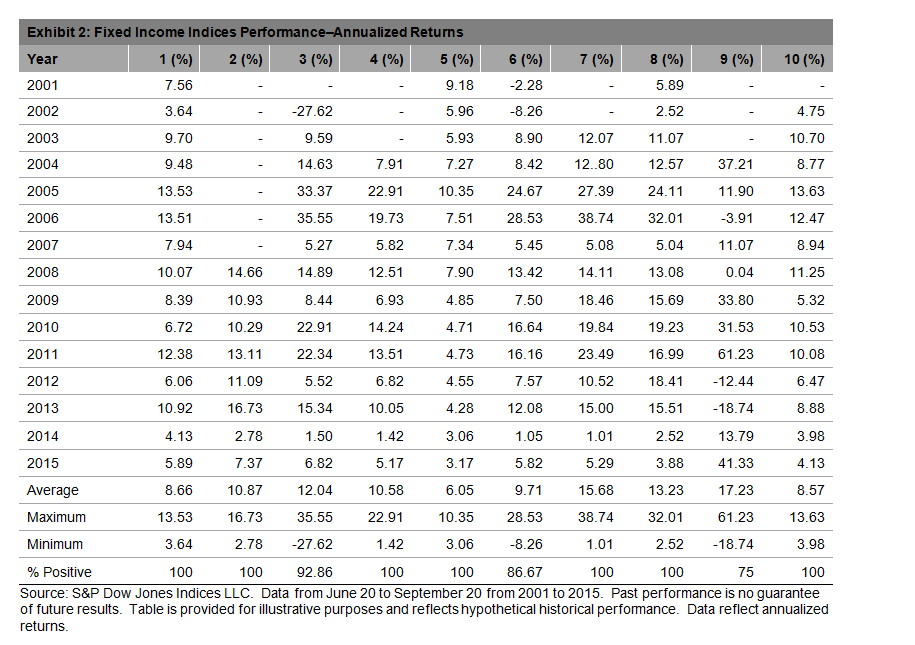
Historically, we can see that the probability of generating a positive return has been high, with 7 out of 10 indices showing positive returns during the summer 100% of the time. The S&P/Valmer Mexico Sovereign International UMS Index had the lowest percent of positive returns, at 75%, and the S&P/Valmer Mexico Sovereign 10 Year MBONOS Index and the S&P/Valmer Mexico Sovereign MBONOS Index had negative returns for their first and first two years, respectively.
There are high return expectations for most of the indices. During the period of June 20 to September 20 from 2001 to 2015, the lowest average return was for the S&P/Valmer Mexico Sovereign 7+ CETES Index, at 6.05%, and the highest average return was for the S&P/Valmer Mexico Sovereign International UMS Index, at 17.23%. Over the same 15-year period, the sovereign curve, as measured by the S&P/Valmer Mexico Sovereign MBONOS Index, had an average return of 9.71%, a maximum return of 28.53%, and a minimum return of -8.26%. The sovereign real rate, as measured by the S&P/Valmer Mexico Sovereign Inflation-Linked UDIBONOS Index, had an average return of 13.23%, and the S&P/Valmer Mexico Corporate Index had an average return of 8.66%. Measuring maximums and minimums, the index with the most dispersion was the S&P/Valmer Mexico Sovereign International UMS Index, with a maximum return of 61.23% and a minimum return of -18.74%, followed by the S&P/Valmer Mexico Sovereign 10 Year MBONOS Index, with a maximum return of 35.55% and a minimum return of -27.62%.
We know that past performance doesn’t guarantee future results, but it can give us a view on how some indices might move. Stay tuned for the next season report.
The posts on this blog are opinions, not advice. Please read our Disclaimers.