Get Indexology® Blog updates via email.

In This List

In Search of the Low Volatility Anomaly

Volatility, Short- and Long-term

Resource Efficiency: A Step Beyond Climate Change

Defaults Are on the Rise

What the Beige Book Hints About the Fed

In Search of the Low Volatility Anomaly

Contributor Image
Fei Mei Chan

Former Director, Core Product Management

S&P Dow Jones Indices

By now we’re very familiar with the oft discussed “Low Vol Anomaly”. Diverging from conventional finance theory, which tells us that risk and return are directly related, low volatility stocks have outperformed over time and, as expected, with lower volatility. Ample research and evidence point to the existence of a low volatility factor comparable to other factors such as beta or small size or cheap valuation. Because this seems to fly in the face of what we think we know about risk and return, the low volatility factor is often referred to as the low volatility “anomaly.” The S&P 500 Low Volatility Index, for example, outperformed its parent S&P 500 (annual growth rate of 10.9% and 9.8%, respectively) despite exhibiting lower risk in the period between 1991 and 2015.

These returns are a snapshot spanning a 25-year period. Low Vol has, of course, underperformed at times during this period, most notably during the inflation of the technology bubble. The chart below maps the five-year performance spread on a rolling basis for a better picture of how Low Vol has behaved over time. Recently Low Vol’s performance spread has drifted around zero. Does this imply that the “low volatility anomaly” is spluttering?

in search of the low vol anomaly1

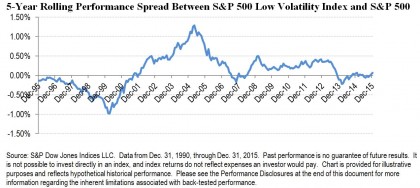
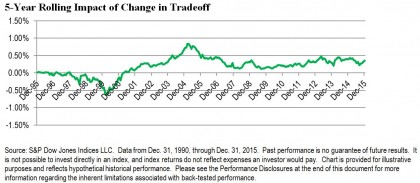
We recently developed a simple methodology that can be used to assess the performance of factor (or other) indices compared to their cap-weighted parents. The methodology attributes a factor index’s excess returns both to its incremental (or decremental) level of risk and to a changed tradeoff between risk and return. We ascribe Low Vol’s “anomaly” to the tradeoff portion of the performance differential and the chart below tracks this element of return on a rolling 5-year basis. The recent performance challenges of Low Vol are attributable to its reduced level of risk in an environment that, until recently, has been favorable for risk-taking. Contrary to what the performance differentials suggested, the low volatility anomaly, as defined by improved tradeoff between risk and return, is alive and well.

in search of the low vol anomaly2


The posts on this blog are opinions, not advice. Please read our Disclaimers.

Volatility, Short- and Long-term

Contributor Image
Craig Lazzara

Former Managing Director, Index Investment Strategy

S&P Dow Jones Indices

This morning’s Financial Times highlighted a study of market volatility suggesting that return and volatility are inversely related — that “the correct response to an increase in volatility…is to exit the market.”

This is certainly true in the short run, as the table below confirms.

Source: S&P Dow Jones Indices.  Monthly total return data for S&P 500, 1991 - 2015.  Table is provided for illustrative purposes.  Past performance is no guarantee of future results.
Source: S&P Dow Jones Indices. Monthly total return data for S&P 500, 1991 – 2015. Table is provided for illustrative purposes. Past performance is no guarantee of future results.

In months when the realized volatility of the S&P 500 was above average, the index’s total return was -0.03%.  When volatility was below average, the index’s average return was a much-improved 1.74%.   And regardless of whether realized volatility was above or below its midpoint, the S&P 500 tends to do much better when volatility is falling rather than rising.

But these are very short-term — indeed, monthly — effects.  What happens when we look beyond a one-month holding period?   Using the history of the Dow Jones Industrial Average (which extends back to 1896), we calculated returns for holding periods of various lengths, conditioned on whether volatility was above or below the 85th percentile of the distribution.  Given what we’ve already observed about the relationship between high volatility and low returns, it’s not surprising that investments made during periods of lower volatility outperform over short holding periods (up to about 11 months).  After that, however, fortune favors the bold:

Source: S&P Dow Jones Indices LLC, The Landscape of Risk, 2014.  Data from July 1896 to September 2012.  Charts and tables are provided for illustrative purposes.  Past performance is no guarantee of future results.

Source: S&P Dow Jones Indices LLC, The Landscape of Risk, 2014. Data from July 1896 to September 2012. Charts and tables are provided for illustrative purposes. Past performance is no guarantee of future results.

The British financier Nathan Mayer Rothschild is reputed to have said “Buy when there’s blood in the streets, even if the blood is your own. The saying may be apocryphal, but the insight it embodies is real enough.  One investor’s short-term risk can be the basis for another’s long-term gain.

The posts on this blog are opinions, not advice. Please read our Disclaimers.

Resource Efficiency: A Step Beyond Climate Change

Contributor Image
Daniel Ung

Former Director

Global Research & Design

In recent years, there has been much focus on the importance of climate change and how much greenhouse gas is produced in the process of conducting business.  While managing greenhouse gases is an important focus, is the future more about increasing efficiency across different depletable resources, such as water?

Because the demand across different scarce resources is correlated, it may be sensible to adopt a holistic approach when managing the efficiency of these resources rather than a disjointed, piecemeal approach.

In the research paper Resource Efficiency: A Case Study in Carbon and Water Use, we investigated whether or not there was an impact on the financial performance of carbon-efficient companies (i.e., companies that generate the least amount of greenhouse gases per U.S. dollar of revenue) and resource-efficient companies (i.e., companies that are efficient across their water use and greenhouse gas emissions).

Despite the limited availability of data, our preliminary findings suggested that, on average, efficient companies (Quintile 1) outperformed inefficient ones (Quintile 5) over a rolling 12-month or rolling forward basis (see Exhibit 1).

Capture

In addition to this, there are other reasons why carbon and resource efficiency are important.  If companies do not promote efficiency in their business activities, some of the risks they may face could adversely affect their future profitability.  For example, there are risks associated with increased regulation, resource depletion, reputation, and financing.

For more details on the results of our research, please click here to access the research paper.

The posts on this blog are opinions, not advice. Please read our Disclaimers.

Defaults Are on the Rise

Contributor Image
Jason Giordano

Director, Fixed Income, Product Management

S&P Dow Jones Indices

The March rebalancing of the S&P U.S. Distressed High Yield Corporate Bond Index saw another increase in the number of qualifying constituents.  This marks the eighth increase of this kind in the last nine months.  The index, which is designed to measure securities with an option-adjusted spread greater than or equal to 1,000 bps, is down 35% over the past one-year period as of March 1, 2016.

While the monthly change in constituents saw a net increase of 53 issues, there were actually 137 new issues that entered the index universe.  Seventy issues were removed from the index as a result of improved credit spreads; however, 14 issues were removed from the index due to default.

Of the 14 issues in default, 10 were in the energy sector (five issuers), while four represented the materials sector (four issuers).  Combined with January’s activity, 14 issuers have been removed from the index due to default this year.  In comparison, there were 64 issuers that defaulted in all of 2015.

Capture

New issues added to the index had a total par amount of over 80 billion (approximately 15% of the index value).  The total par value of the index has increased 300% since July 2015.

Capture

Not surprisingly, the energy sector is the leader for both number of issues added and percentage of par amount added to the index.  There were a total of 72 issuers that were added to the index with representation from all 10 sectors.

Capture

The posts on this blog are opinions, not advice. Please read our Disclaimers.

What the Beige Book Hints About the Fed

Contributor Image
David Blitzer

Former Managing Director and Chairman of the Index Committee

S&P Dow Jones Indices

The latest copy of the Beige Book, the Federal Reserve’s survey of the economy, was released today in preparation for the next FOMC meeting on March 15th-16th.  The picture it paints of the economy is far better than what one might assume from the stock market’s recent gyrations – but probably not good enough to support another increase in the Fed funds rate this month.

Residential and commercial real estate are the strong spots in the economy while energy and agriculture are the weak ones. Consumer spending is rising in most places, nonfinancial services are reporting gains and manufacturing is flat to slightly positive. Auto sales are good in most areas. Export activity is hurt by the strong US dollar and lackluster economies among major trading partners.  Recent data support this. Home prices continue to rise and sales of existing homes are strong, consumer spending and personal income in January was better than expected and the Institute of Supply Management index for manufacturing rose in February. Labor markets are reported to be improving, consistent with the ADP payrolls number released this morning. Wage gains vary across the country and prices are generally flat according to the Beige Book.

The Fed’s decision on when to raise interest rates is should it take the generally positive beige book and recent better-than-expected economic reports as a reason to move soon, or should it be worried about the stock market’s two months of turmoil?  The chart puts this into a picture: the steady growth of nonfarm payrolls vs. the S&P 500 ups and downs.

Inflationary expectations are low and the Fed’s principal inflation gauge – the core PCE deflator – is under its target. Nothing in the Beige Book makes a case for an immediate Fed rate hike at the upcoming meeting.  Hopefully the FOMC statement on March 16th will have some hints for the future and be interesting reading.

The posts on this blog are opinions, not advice. Please read our Disclaimers.