Financial advisors who implement style investing seek to outperform the blended benchmark whenever they believe that market conditions will favor either a growth or a value approach. Their view could be influenced by research, fundamental factors, or technicals. To implement such a view does not require 100% conviction in either growth or value. In fact, some prefer to “tilt” toward growth or value by maintaining a reduced position in the less-favored style. As a hypothetical example, advisors have shown me portfolios with a 60% weighting in value and 40% in growth. Such an example overweights value stocks compared to the blended benchmark.
If we accept that some style investors “tilt” as their implementation technique, then we recognize that these advisors are creating a mixed basket of stocks that have a combination of growth and value characteristics. In accepting this mix, many advisors overlook that the overlap in styles is more profound than they may expect based on a “technical” term that I call “the muddle in the middle.”
This “muddle in the middle” is a side effect of the way most index providers create style baskets. Using the S&P 500® as an example, Exhibit 1 shows how the S&P 500 Growth and S&P 500 Value are constructed.
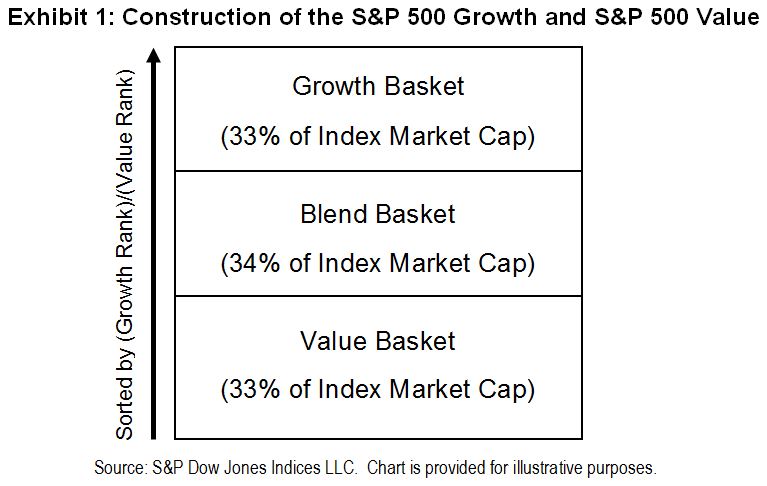
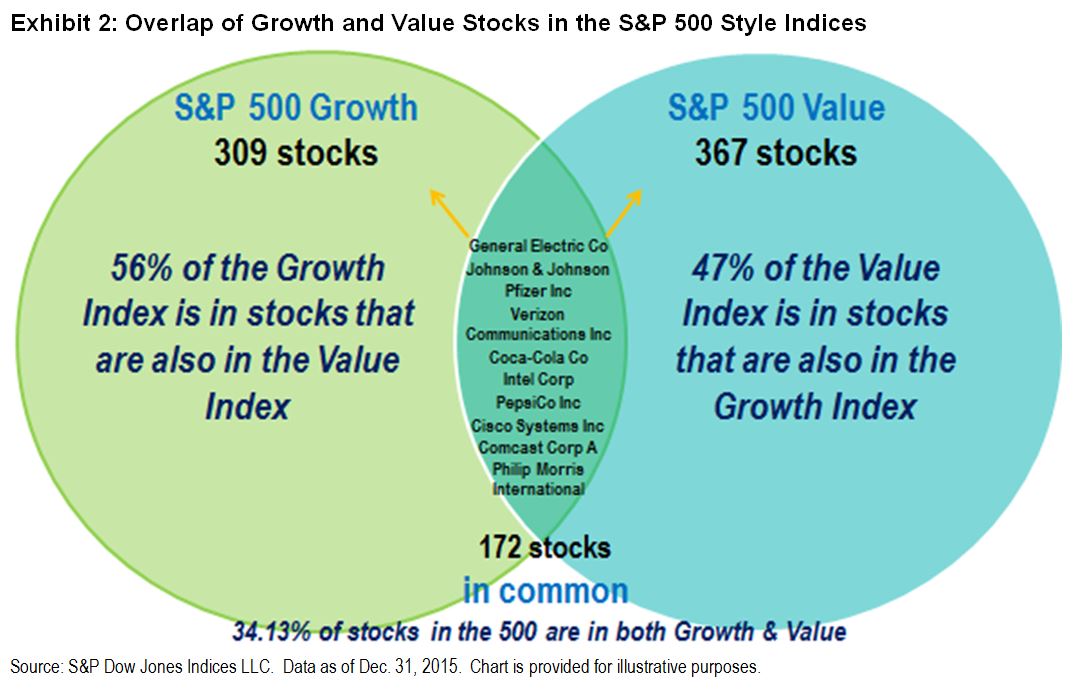
While this index construction technique has existed for many years and is widely practiced, it is less understood that the stocks in the middle, or blend basket, are assigned to both the growth and value indices. This “muddle in the middle” currently leads to 172 overlapping stocks in the S&P 500 Style Indices that don’t have strong growth or value characteristics (see Exhibit 2).
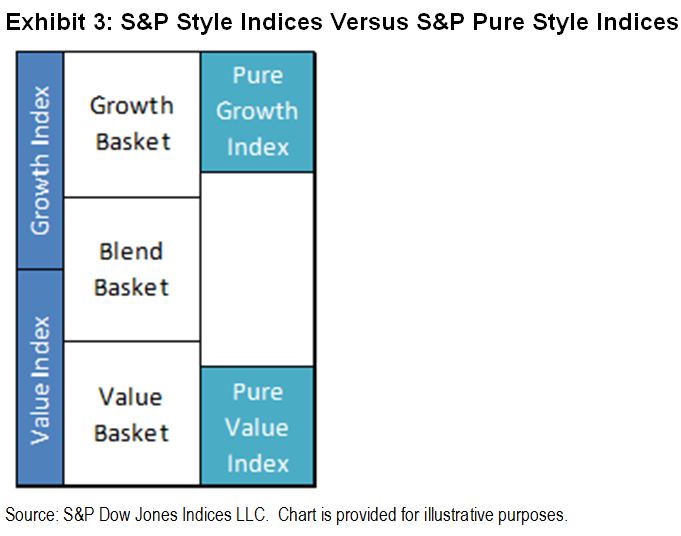
The S&P Pure Style Indices were created to measure concentrated style expressions while eliminating the blend basket. The S&P Pure Style Indices measure, select, and retain only the strongest growth and value stocks and weight the constituents in accordance with their style score. The two approaches to basket selection can be compared in Exhibit 3 with the S&P Style Indices on the left and the S&P Pure Style Indices on the right.
The S&P Pure Style Indices seek to create style baskets without any stock overlap. The S&P Pure Style Indices eliminate the “muddle in the middle” problem for style investing (see Exhibit 4).

The ramification for advisors employing a style tilt is that the same 60% value and 40% growth tilt imagined before now results in zero stocks overlapping in the resulting portfolio, instead of 172. S&P Dow Jones Indices has over 10 years of live index history for the S&P Pure Style Indices (launched on Dec. 16, 2005) that can be shared with advisors in the S&P 500, S&P MidCap 400®, and S&P SmallCap 600® size classifications.
Sam Stovall, Equity Strategist at S&P Global Market Intelligence, plans to cover S&P Pure Style Indices as Smart Beta in one of his “7 Rules of Wall Street Strategies” at our FA Forum in Miami on Feb. 24, 2016. Advisors may register at no cost to attend in person or by live streaming.
The posts on this blog are opinions, not advice. Please read our Disclaimers.