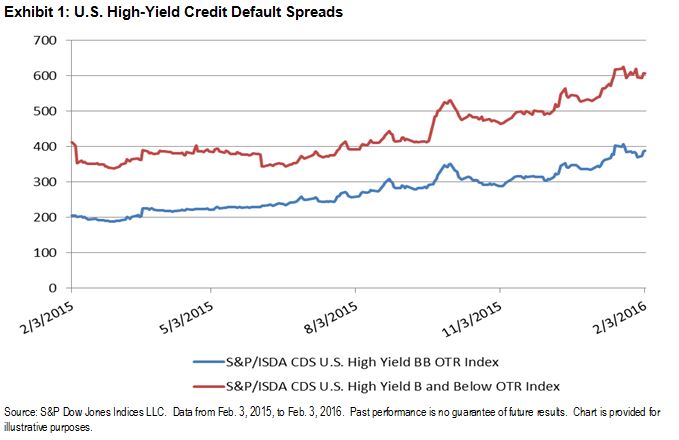
While the slumping price of oil is bearing the brunt of the current volatility in the markets these days, there are other signs that indicate more widespread shifts in the credit cycle. High-yield credit default spreads have widened, as shown by both the S&P/ISDA CDS U.S. High Yield BB and the S&P/ISDA CDS U.S. High Yield B and Below. The indices are up 183 and 197 bps, respectively, over the past year (see Exhibit 1). The turmoil in the energy sector has had an impact; however, the widening also represents the overall discomfort with the amount of leverage companies have on their balance sheets within the broader high-yield market.
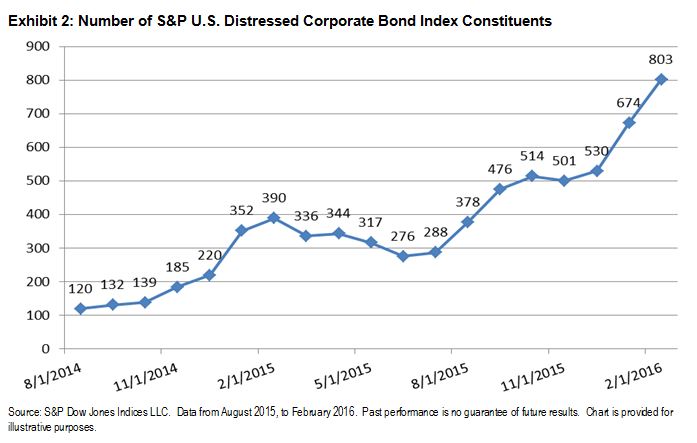
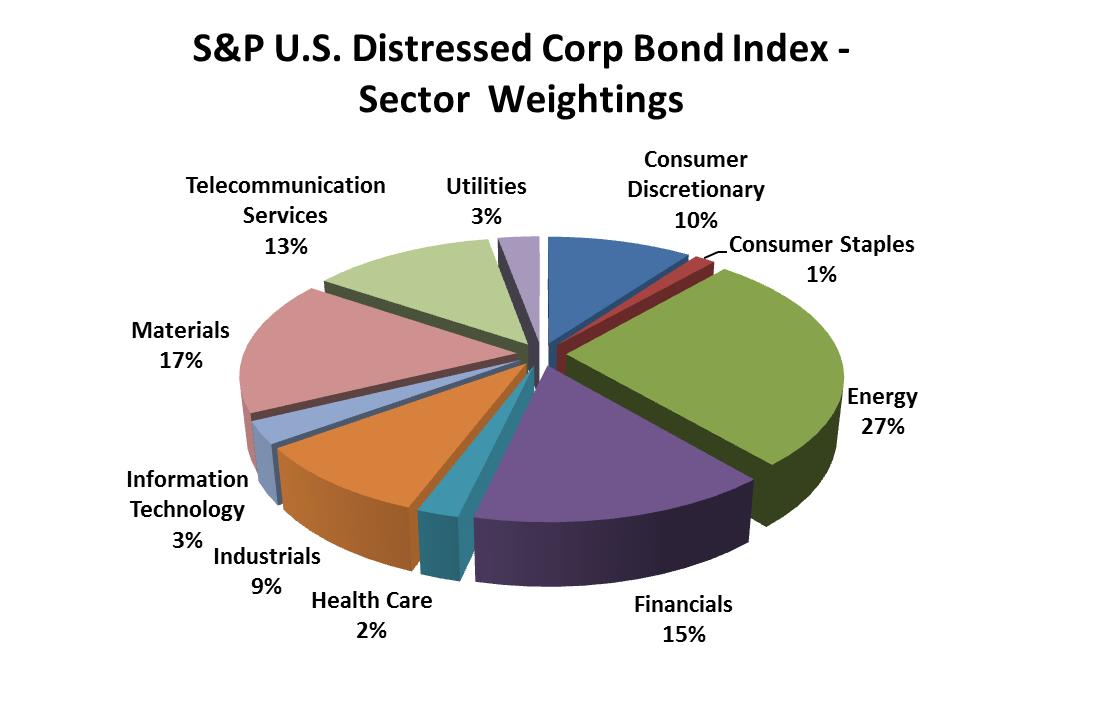
Further evidence is shown by the S&P U.S. Distressed High Yield Corporate Bond Index. The index is a market-weighted index comprising securities with an option-adjusted spread greater than or equal to 1,000 bps. The number of qualifying constituents (see Exhibit 2) has increased dramatically since August 2014, with 89 new issuers entering the index just this month. Again, the increase is not limited to only the Energy sector as new constituents represent Telecom, Financial, Consumer Discretionary and Materials sectors.
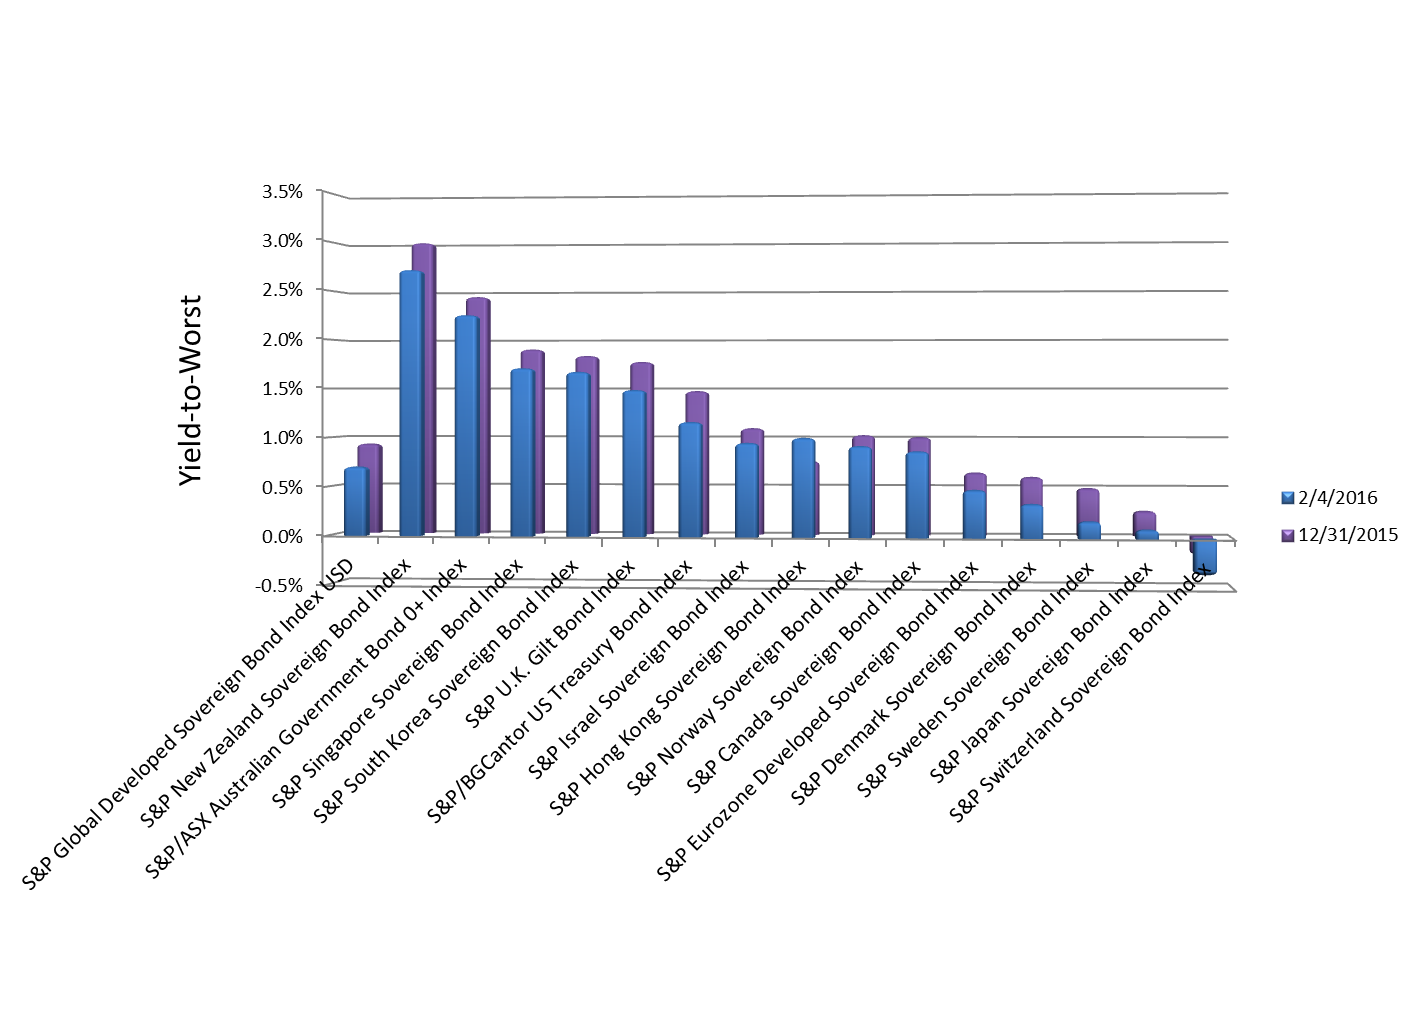
 Source: S&P Dow Jones Indices LLC. Data from February 2016. Chart is provided for illustrative purposes.