For large superannuation funds and other investors with institutional-sized portfolios, a common practice is to spread the allocation to a particular asset class among a number of managers within a “multi-manager” structure. This provides the benefits of diversification not only across asset classes, but also within key allocations like Australian and global equities. The aim of good manager selection is to construct an optimal style blend, noting that no one style is likely to perform well in all market conditions.
Manager research and selection is a specialist skill that requires a comparison of alternative managers across an array of attributes, especially their performance “track record.” It is well accepted that past performance is no predictor of future results, so other attributes to be considered typically include each manager’s credentials, experience, fees, structures offered, technology, research pedigree, operational support, and trading efficiency. Large superannuation funds will typically engage an asset consulting firm to assist them with manager research and may also subscribe to surveys and publications that report and rank manager performance.
Because so much attention is paid to managers’ performance track records, the way that performance is measured and compared by funds and advisors is important. Yet, there is a vital piece of the picture missing, a concept that is continually overlooked when assessing managers’ performance: taxes. Superannuation funds, like most investors, are subject to taxes on investment performance, and what really matters is “what members and investors eat” in the form of after-tax returns. In an ideal world, it would be reasonable to assume that manager performance is, as standard practice, measured and compared on an after-tax basis. Unfortunately, this assumption is wrong.
Consider two hypothetical international equity managers holding the same stock from the perspective of a taxable superannuation fund client with realized capital losses (see Exhibit 1).
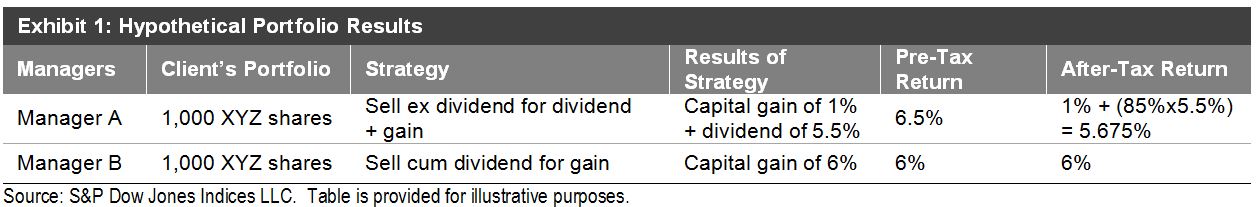
In this scenario, a pre-tax focus tells the client that manager A is superior to manager B. When faced with a reason to change the investor portfolio, the client is (in the absence of other differences) more likely to withdraw money from manager B than manager A, or terminate the mandate altogether. Yet, viewing each manager’s performance through an after-tax lens shows that manager B has been more successful at building wealth for the superannuation fund client.
In part 2 of this article, we move from the hypothetical to an actual 10-year performance history of 198 U.S. managers. We depict the “one-dimensional” view by plotting the pre-tax performance of these managers along a y-axis where seemingly “superior” managers rise to the top. We then create a “two-dimensional” view by plotting these managers’ performance on an after-tax basis along an x-axis to show how truly revealing a two-dimensional view of manager performance can be.
The posts on this blog are opinions, not advice. Please read our Disclaimers.