Get Indexology® Blog updates via email.

In This List

Using Indexing Tools for Risk Management — Sophisticated Strategies from Basic Building Blocks

Sukuk Market in 2015: Year in Review

Sector Diversification: A Better Way to Track the Chinese Equity Market?

As goes the first week, so goes …

Asian Fixed Income: 2015 Pan Asia Report Card

Using Indexing Tools for Risk Management — Sophisticated Strategies from Basic Building Blocks

Contributor Image
Jerry Miccolis

Principal and Chief Investment Officer

Giralda Advisors

Advisors today share a problem new to the careers of all but the eldest of us. As I discussed in a recent webinar, at Giralda Advisors, we call it the Portfolio Problem — unique in the last 30 years and arguably the most significant issue facing financial planning professionals over the next several years, if not decades.

The Portfolio Problem arises from these facts:

  • Most investors need a sizeable allocation to equities in their portfolios
    • Equities are the primary driver to help them achieve their long-term financial goals and stay ahead of inflation
    • However, equities are volatile and subject to significant drawdowns
  • Non-equity asset classes, a key purpose of which is to buffer the risk of equities, have become problematic
    • Fixed income investments, in particular, are poised for historically poor returns for the next several years, as their 30-year bull run fueled by declining interest rates is coming to an end — this is what makes the Portfolio Problem unique in the last three decades
    • Attempts to enhance fixed income returns introduce their own problems — increased risk and increased correlation with equities — that compromise the mission of this asset class
  • Diversification itself does not always protect the portfolio from equity risk
    • Contagion among asset classes, which occurs in times of extreme market stress, is immune to diversification
    • Even in the best of environments, portfolio risk mitigation through diversification is not guaranteed

So, how does a financial advisor solve the Portfolio Problem? We believe the answer may lie in an approach we call risk-managed investing (RMI). RMI attempts to explicitly mitigate equity risk at its source — directly within the equity investment itself, via dampening volatility and/or limiting downside potential. Let us illustrate by example how this can be done.

The two primary risks facing equity investors include recurring bear markets and sudden, severe market crashes. An effective RMI strategy attempts to address both of these risks.

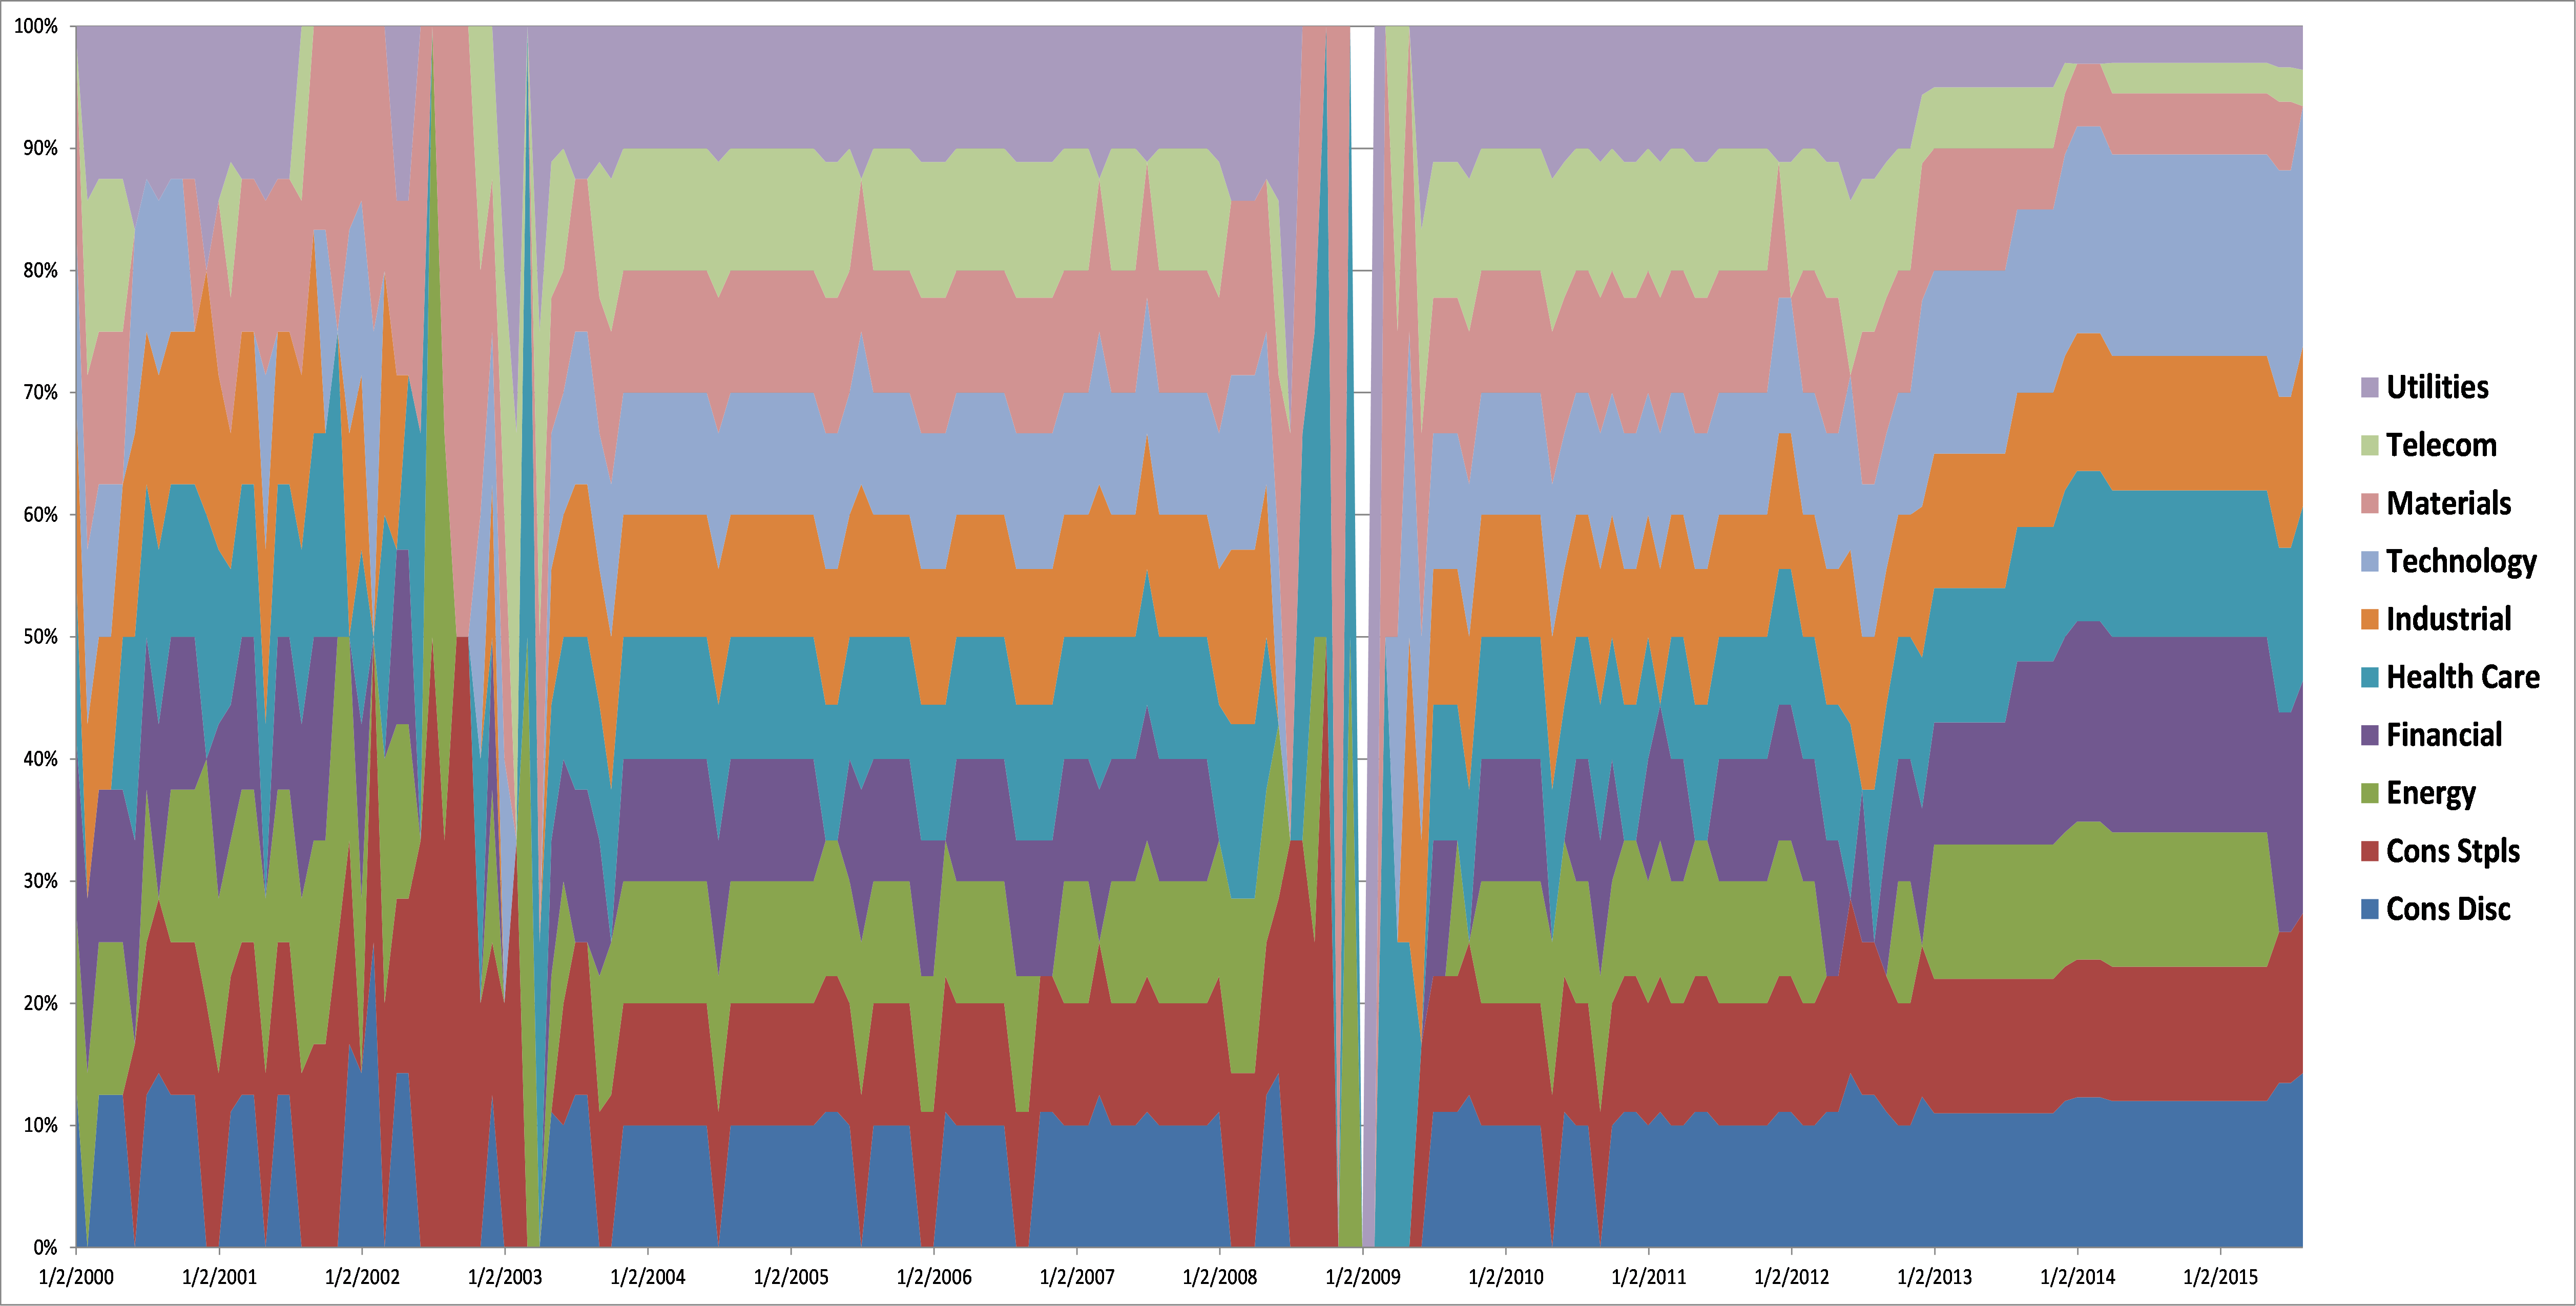
Our RMI approach seeks to tackle bear market risk through a momentum-based sector rotation strategy. After detailed modeling and rigorous testing with basic industry sector indexes, we developed a strategy that provides buy and sell signals with the goal of exiting early from sectors that lead market declines. We execute the strategy with highly liquid industry sector ETFs. An illustration of the sector activity within our Sector Dynamics RMI strategy is shown in the graph below.

Giralda_chart

We address market crash risk with an RMI strategy that incorporates a custom-designed suite of tail risk hedges. These hedges are delivered via swaps whose value is derived from proprietary volatility-based indexes. The idea is to capture and monetize the spikes in volatility that typically accompany sharp equity market declines and to do so very cost-effectively. Several of these indexes are based on signaled exposure to VIX, itself a very popular volatility-based index.

We benchmark our RMI strategies against relevant indexes. Three in particular developed by S&P/CBOE that are very well suited to RMI are:

  • PPUT — an index of the S&P 500 and a rolling put
  • CLL — an index of the S&P 500 and a rolling collar
  • VXTH — an index of the S&P 500 and a VIX-based tail risk hedge

Indexing has played an important role in our RMI efforts, from strategy development, to product construction, to benchmarking. By using accessible indexing tools, a properly implemented RMI strategy can provide a sophisticated, innovative approach to mitigating downside portfolio risk — thereby elegantly solving the Portfolio Problem.

——————————————————————————————–
This material is for informational purposes only. Nothing in this material is intended to constitute legal, tax, or investment advice. Investing involves risk including potential loss of principal.
The views and opinions of any contributor not an employee of S&P Dow Jones Indices are his/her own and do not necessarily represent the views or opinions of S&P Dow Jones Indices or any of its affiliates.  Information from third party contributors is presented as provided and has not been edited.  S&P Dow Jones Indices LLC and its affiliates make no representations or warranties of any kind, express or implied, regarding the completeness, accuracy, reliability, suitability or availability of such information, including any products and services described herein, for any purpose.

The posts on this blog are opinions, not advice. Please read our Disclaimers.

Sukuk Market in 2015: Year in Review

Contributor Image
Michele Leung

Former Director, Fixed Income Indices

S&P Dow Jones Indices

The sukuk market demonstrated resilience despite the decline in oil price and global uncertainty; the Dow Jones Sukuk Index, which tracks USD-denominated, investment-grade sukuk, rose 1.24% in 2015, while the Dow Jones Sukuk High Quality Investment Grade Total Return Index gained 1.00% in the same period.  Looking closer at index constituents, the underperformers were sukuk issued by Saudi Electric, which were weighted down by the lower oil price, and the sovereign sukuk issued by Bahrain and South Africa.

From the supply perspective, we saw sovereign issuers from Malaysia, Indonesia, and Hong Kong, along with a few issuances from banks and a few corporates from GCC and Malaysia in the past year.  There were a total of 15 new sukuk with a total par amount of USD 11.95 billion being added into the Dow Jones Sukuk index, and 48% of them were from the Middle East and North Africa (MENA).  Though the amount of sukuk issued in U.S. dollars tracked by the index dropped in 2015, it is still a respectable level given the challenging market conditions (see Exhibit 1).

In fact, the sukuk issuance from MENA showed a diminishing trend in 2015, according to the Dow Jones Sukuk Index; Bahrain and Saudi Arabia had no issuance, while Qatar only managed to launch one sukuk of USD 750 million.  The United Arab Emirates is the only country in the Dow Jones Sukuk High Quality Investment Grade Total Return Index GCC that maintains stable issuances, and it is also the biggest USD sukuk issuing country, representing 24% of the overall index exposure.

From the demand side, the sukuk was well received overall.  In particular, the Malaysia Sovereign sukuk received strong support from investors across Asia, the U.S., and Europe. While the issuance in Q3 2015 was muted, the sukuk launched in Q4 2015 received a solid order book of two-to-three times oversubscribed.

Among the ratings-based subindices, the bucket rated ‘BBB’ outperformed and rose 2.14% in 2015. Interestingly, the bucket rated ‘AA’ dropped 0.62% in the same timeframe, due to the significant drop in Saudi Electric sukuk, which represents over 60% of the Dow Jones Sukuk AA Rated Total Return Index.  The shorter maturity indices also performed better than the longer maturity ones in 2015.  The Dow Jones Sukuk 3-5 Year Total Return Index rose 2.02% for the year (see Exhibit 2).

Exhibit 1: Total Par Amount of New Sukuk Issuances

20160111a

Exhibit 2: Performance of the Dow Jones Sukuk Index Family in 2015

20160111b

The posts on this blog are opinions, not advice. Please read our Disclaimers.

Sector Diversification: A Better Way to Track the Chinese Equity Market?

Contributor Image
Ellen Law

Former Associate Director, Asia Pacific Market Development

S&P Dow Jones Indices

Different sectors within the same country can perform differently.  Not all sectors of the economy perform well during a bull market and vice versa.  Hence, an investment fund heavily focused on one or two sectors could be more volatile and susceptible to a single market incident or regulatory measure.  In addition, no particular sector can shine in all economic climates and will have ups and downs during different periods.  To attempt to reduce volatility caused by this sector movement, an investment fund (tracking a single country in particular) could track an index with a more diversified sector allocation.

Chinese Equity Indices Concentrate on the Financial Sector
When we take a closer look at some key Chinese indices which track the Chinese equity market, we see that they tend to have a high allocation to the financial sector, some even more than 50%.  In fact, many Chinese financial companies are massive, and some of them are state-owned enterprises supported by the government.  They tend to have large market capitalization and are liquid, enabling them to pass the market-cap and liquidity screens required by the Chinese indices, therefore making them eligible for index inclusion.

However, the Chinese indices selecting the largest stocks tend to overweight the financial sector but underweight other growing sectors that do not have a high market cap.  In order to give an accurate representation of the broad Chinese equity market, an index should be more diversified across different sectors.

The S&P China 500 Enhances Sector Diversification
To approximate the sector composition of the broader Chinese equity market, the S&P China 500 has a unique constituent selection criteria.  This index compares and matches the sector breakdowns of selected stocks in the S&P Total China BMI, which consists of about 3,000 constituents and represents the entire investable universe of Chinese companies.  The S&P China 500 is less concentrated in the financial sector compared with other key China indices (such as the S&P China A 300 Index) and closely matches the sector weights of the broad Chinese equity market, as represented by the S&P Total China BMI (see Exhibit 1).

Capture

The posts on this blog are opinions, not advice. Please read our Disclaimers.

As goes the first week, so goes …

Contributor Image
Tim Edwards

Managing Director, Index Investment Strategy

S&P Dow Jones Indices

The world’s equity markets have encountered a rocky introduction to 2016; including the worst ever start for the Dow Jones Industrial Average (against a record that stretches back to 1897) and steep falls across developed and emerging markets.  Equity markets are down more or less everywhere, and in many cases materially so.

What difference does a week make?

Does the performance in the first seven days of the year matter to investors who intend to hold through to year-end?  One would suppose not especially: there are 51 weeks to go, we have covered less than 2% of the year and – in the abstract –the first week’s performance should have only a tiny (although certainly non-zero) influence on the whole year’s return.  Yet, history suggests the opposite.  Some weeks were more important than others, and the performance in first week of the year was particularly indicative of the year’s returns.

How important is the first week?

Taking the international blue-chip S&P Global 1200 and its performance over the past 25 years as our object of study (similar results may be obtained with the S&P 500), it is clear that there is a strong historical relationship between the performance during the first week of the year and the overall year’s return, with a positive correlation of 0.41.  Pic1
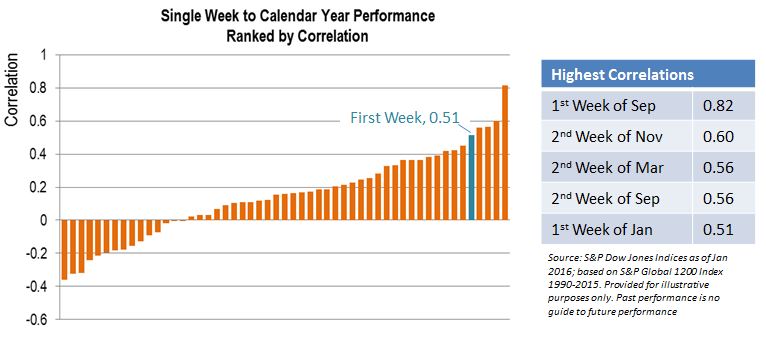
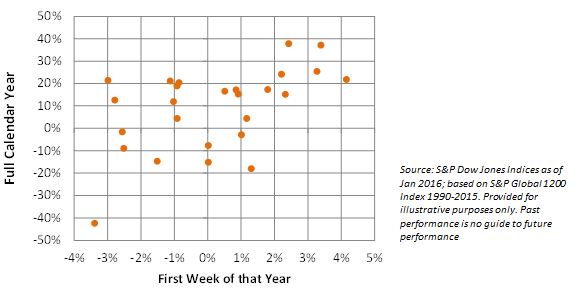
Not all weeks are equally important

Some weeks seem to be more important than others, or even provide an entirely opposite relationship to that expected; the third week in May, for example, seems to be negatively related to performance throughout the remainder of the year. (Support, perhaps, for notion that one should “sell in May and go away”.)Pic2

Which is the most important week?

Perhaps thanks to the return of investors from their holidays and the frequent location of elections during the period, the first week of September appears to be the most influential week for returns.  This is followed by the second weeks of November and March, then the second week of September.  The first week of the year appears in fifth place – still pretty influential, but far from the most important.Pic3

Conclusions

Historically speaking, years that have started badly have more frequently ended badly – and to a greater extent than might be supposed, given the expected impact of a single week’s performance.  However, those who wish to divine the market’s yearly performance from that of a single week might be better off waiting until September.


The posts on this blog are opinions, not advice. Please read our Disclaimers.

Asian Fixed Income: 2015 Pan Asia Report Card

Contributor Image
Michele Leung

Former Director, Fixed Income Indices

S&P Dow Jones Indices

Despite the weakness in local currencies, the S&P Pan Asia Bond Index, which is designed to track local currency bonds in 10 countries and is calculated in USD, delivered a total return of 1.45% for 2015.  The S&P Pan Asia Corporate Bond Index rose 2.54% in the same period, outperforming the S&P Pan Asia Government Bond Index.

Among the 10 countries tracked by the S&P Pan Asia Bond Index, India was the best-performing country for the year; the S&P BSE India Bond Index rose 8.40% in 2015, while its yield-to-maturity closed at 7.89%.  The S&P China Bond Index went up 8.05%, despite the equity market volatility and slowdown in China.  Though these returns were shy of their double-digit gains of 2014, the gains were robust given the challenging market conditions.  Indonesia had a volatile year, the S&P Indonesia Bond Index managed to reverse its earlier loss in Q3 2015 and ended the year with a 4.35% total return; its yield-to-maturity reached 8.88% and it was the highest-yielding country in the region.

The size of Asia’s local currency bond markets, as measured by the S&P Pan Asia Bond Index increased 21% to USD 8.40 trillion in 2015, which reflected the continuous market expansion.  The market value tracked by the S&P China Bond Index expanded 40% to RMB 36.9 trillion, fueled by the municipal bond replacement program and the growth in the corporate market.

Exhibit 1: Total Return of the S&P Pan Asia Bond Index Series in 2015

20150108a

Source: S&P Dow Jones Indices LLC.  Data as of Dec. 31, 2015.  Chart is provided for illustrative purposes only.

Exhibit 2: Yield-to-Maturity of the S&P Pan Asia Bond Index Series

20150108b

Source: S&P Dow Jones Indices LLC.  Data as of Dec. 31, 2015.  Chart is provided for illustrative purposes only.

The posts on this blog are opinions, not advice. Please read our Disclaimers.