Get Indexology® Blog updates via email.

In This List

The Rieger Report: Municipal Bonds - In volatile markets boring did the job

The Rieger Report: Bonds in 2016?

The Rieger Report: S&P 500 & Investment Grade Munis - Neck & Neck

The Rieger Report: Energy bonds - $25 billion gone in 5 months

The Rieger Report: 500 Index Sectors - stocks vs. bonds

The Rieger Report: Municipal Bonds - In volatile markets boring did the job

Contributor Image
J.R. Rieger

Former Head of Fixed Income Indices

S&P Dow Jones Indices

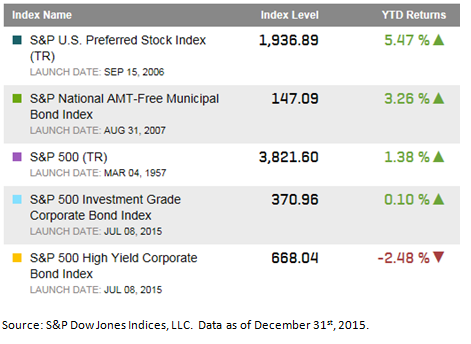
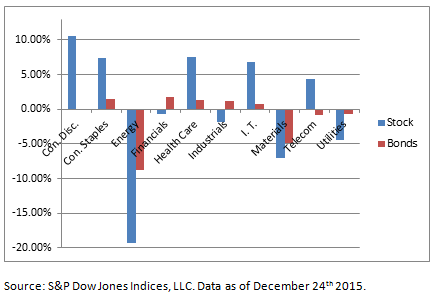
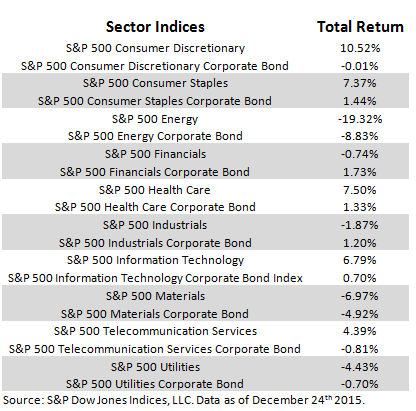
The S&P Municipal Bond Index recorded a positive 3.32% total return in 2015 securing a second place finish among major asset classes.  Volatility plagued the equity and commodities markets which also tore into the corporate bond materials and energy sectors. While municipal bonds were steady throughout 2015 it had own challenges as Puerto Rico continues it’s seemingly endless financial struggles.

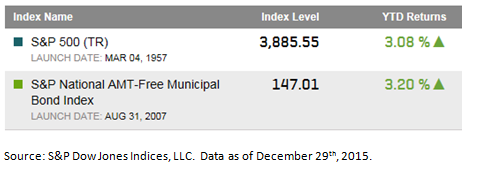
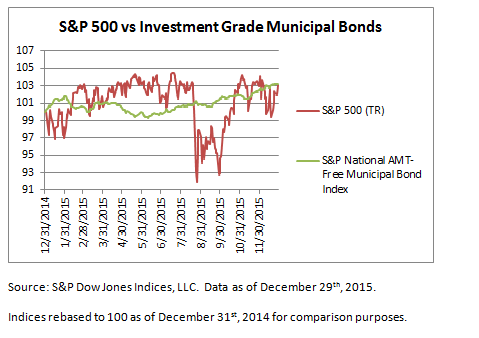
Table 1: Select asset class indices and 2015 total returnsBlog 1 4 2016 Table 1

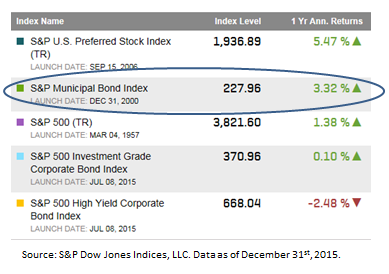
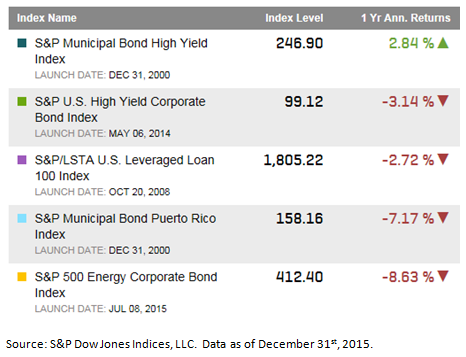
Of the broader municipal bond market segments, taxable municipal bonds had the lowest returns of 1.3% while the broad revenue bond segment recorded a return of over 4%.

Table 2: Select Municipal Bond Indices, year-end yields and 2015 total returnsBlog 1 4 2016 Table 2

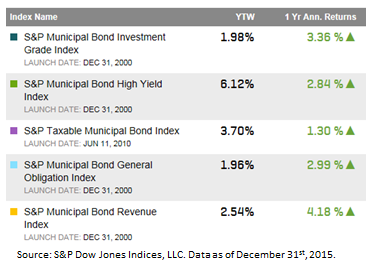
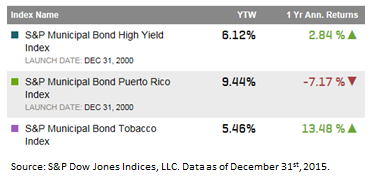
The S&P Municipal Bond Puerto Rico Index logged a -7.17% return in 2015 which played a significant role in muting the returns of the S&P Municipal Bond High Yield Index.  The S&P Municipal Bond Tobacco Index rebounded in 2015 with a positive 13.48% return driven by successful refundings replacing high cost debt with bonds with lower interest rates.

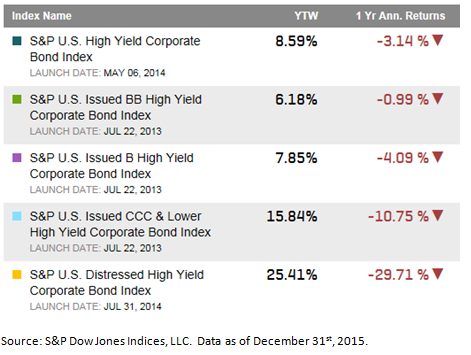
Table 3: Select municipal bond high yield indices, year-end yields and total returns for 2015Blog 1 4 2016 Table 3

The posts on this blog are opinions, not advice. Please read our Disclaimers.

The Rieger Report: Bonds in 2016?

Contributor Image
J.R. Rieger

Former Head of Fixed Income Indices

S&P Dow Jones Indices

2015 had been a year of low or no returns for major asset classes.  Income asset classes such as preferred stock and municipal bonds did outpace the S&P 500 Index and did so without the volatility but others did not bode as well. What about 2016? Let’s look at the leaders for 2015 first:

From a total return perspective the S&P U.S. Preferred Stock Index returned over 5.4% in 2015 with investment grade municipal bonds tracked in the S&P National AMT-Free Municipal Bond Index returning just over 3.25%.  Investment grade corporate bonds issued by ‘blue chip’ companies tracked in the S&P 500 Investment Grade Corporate Bond Index barely held even and corporate junk bonds ended in the red.  The traits of each market may give us a hint as to what 2016 may look like.

What might impact the 2016 investment grade bond market?

  • A slow rising interest rate environment is generally expected by the markets.  A change to that expectation could rattle the bond markets.  Status quo could help hold yield spreads low and prices up.
  • The high quality and relatively low volatility nature of investment grade bonds may remain attractive if the equity, commodity and junk bond markets continue to see volatility.
  • Pension funds have longed for higher yielding but quality fixed income assets to match their obligations.  That demand may help hold yield spreads in place for investment grade bonds.
  • Investment grade municipal bonds have seen steady demand and that demand has not yet been offset with a sharp rise in new debt issuance.  The supply / demand imbalance persists as we enter 2016 but could change over time if new issuance resurges.   Beyond Puerto Rico, now affecting the municipal high yield segment, headline risk is low but bears watching. Overall, the low volatility, low default rate and tax-free income of municipal bonds may all continue to contribute to keeping demand up for this asset class.
  • The investment grade corporate bond market is expecting less new issuance and some projections are for a steep drop in new issuance in 2016.  This could impact the supply / demand equilibrium and help to hold yield spreads relatively low when compared to U.S. Treasuries.  High quality and incrementally higher yielding corporate bonds may continue to draw investor interest as an alternative to U.S. Treasuries as a result.
  • Floating rate preferred stock is an asset class designed to pay dividends that rise and fall with base interest rates.  As rates go up, this may be a key driver of the asset class performance in 2016.  Demand for fixed rate preferred stock could remain strong as alternatives that offer incrementally higher yields come with increased credit risk.

Table 1: Select indices and their 2015 total returns

2015 Yr End

What might impact the 2016 ‘junk’ bond markets?

  • Yield spreads of junk bonds could widen further. This is even more dangerous to high yield bond holders than modest rate increases.  Rising corporate bond default expectations could put pressure on yield spreads pushing bond prices down on these fixed rate unsecured obligations.
  • The  energy and materials sectors have played big roles in the performance of the overall junk bond market.  Any rebound or continued depression of the price of oil could have a dramatic affect on these sectors.  The single B and CCC segments of the market have been volatile as a result.  Please refer to Table 3 for returns.
  • Senior loans tracked in the S&P/LSTA U.S. Leveraged Loan 100 Index  were down in 2015 along with their ‘junk’ bond counterparts.  Another modest rate hike will help these senior secured floating rate notes.  Generally, as rates go up these  senior loans will pay higher interest rates.  Historically, senior loans have had a lower default rate than corporate bonds.  Over the last several years, holder protections, or covenants, have been favoring the borrowers, so if defaults do rise this could impact this market. It should be noted that in a distressed situation, senior loans do get paid before unsecured debt.  In general, the senior loan asset class has lower exposure to the energy and materials sector than the fixed rate high yield corporate bond asset class.
  • Demand for yield in the municipal bond market continues to be strong. However, Puerto Rico has been a real and significant drag on performance for the bond funds that hold this paper.  Beyond Puerto Rico defaults have remained low.  The taxable equivalent yield of high yield municipal bonds vs. high yield corporate bonds may continue to give the yield advantage to municipal bonds in 2016.
  • The liquidity of the junk bond markets was tested in 2015.  It is reasonable to expect more scrutiny of the liquidity of the lowest quality segments of the junk bond markets in 2016.

Table 2: Select high yield indices and 2015 total returns

2015 HY Big Picture Yr End

Table 3: Select U.S. high yield corporate indices and their total reutrns

2015 HY Yr End


The posts on this blog are opinions, not advice. Please read our Disclaimers.

The Rieger Report: S&P 500 & Investment Grade Munis - Neck & Neck

Contributor Image
J.R. Rieger

Former Head of Fixed Income Indices

S&P Dow Jones Indices

2015 has been the year of low or no returns but some positive returns are being realized. With the backdrop of volatility seen in the equity markets and the headline risk headwinds the municipal bond faced all year the total returns of the two asset classes have converged at approximately 3% year-to-date.

The S&P 500 has recorded a total return of 3.08% while investment grade tax-free municipal bonds tracked in the S&P National AMT-Free Municipal Bond Index have seen a total return of 3.2%.  (It is noted that municipal bond indices take into account the interest accrued to bondholders however not the ensuing tax benefits of the interest income.)

Risk adjusted returns would favor municipal bonds as equities have done it the hard way with a standard deviation (a measure of volatility) of over 2.6% while munis have seen a standard deviation of under 1%.  Chart 1 below illustrates the volatility of the two asset classes by tracking the total return index levels of both indices over the course of 2015.

Table 1: Year-to-date returns

500 v munis 12 29 2015

Chart 1: Index levels (rebased to 100)

500 v munis graph 12 29 2015

The posts on this blog are opinions, not advice. Please read our Disclaimers.

The Rieger Report: Energy bonds - $25 billion gone in 5 months

Contributor Image
J.R. Rieger

Former Head of Fixed Income Indices

S&P Dow Jones Indices

The decline in the energy sector has impacted the total market value of bonds in the S&P 500 Energy Corporate Bond Index by over $25 billion since July 31st.   The index has recorded a total return of -8.05% during these 5 months and -8.61% year-to-date.

What is even more worrisome is the cost of buying default protection on debt of issuers in the S&P/ISDA CDS U.S. Energy Select 10 Index has doubled during that time. This indicates an increase in defaults is expected in this sector.

Table 1: Select indices and year-to-date returns:

Energy returns 12 28 2015

Chart 1: Select Credit Default Swap Indices

Energy CDS 12 28 2015

Note: The S&P/ISDA U.S. 150 Credit Spread Index tracks the largest debt issuers in the S&P 500 Index.  The S&P/ISDA U.S. Energy Select 10 Index tracks the largest debt issuers of energy companies with consistent credit default swap spread data.


The posts on this blog are opinions, not advice. Please read our Disclaimers.

The Rieger Report: 500 Index Sectors - stocks vs. bonds

Contributor Image
J.R. Rieger

Former Head of Fixed Income Indices

S&P Dow Jones Indices

Stocks and bonds behave differently in most market environments and the resulting low historical correlation between the two has been an important factor in many investment strategies. With the launch of the S&P 500 Bond Index we can now compare the performance of stocks and bonds of the same ‘blue chip’ entities in the iconic S&P 500 Index.

Highlights (total returns used for comparability):

  • The energy and materials sectors have been significant drags on both the stock and bond markets.
  • The utilities sector has been a drag on the equity sector but less so for the bond market.
  • The consumer discretionary, consumer staples, health care and I.T. sectors have been contributing to the equity markets returns while bond market returns for these sectors have been muted by the low rate environment seen throughout 2015.
  • The S&P 500 Energy Index is down over 19.3% year-to-date while the S&P 500 Energy Corporate Bond Index is down over 8.8% year-to-date.
  • The S&P 500 Materials Index is down over 6.9% while it’s bond counterpart is down over 4.9%.

Chart 1: Selected S&P 500 Sector Indices for both stocks and bonds

Sector Bar Chart 12 24 2015

Table 1: Selected S&P 500 Sector Indices for both stocks and bonds (Year-to-date Total Returns through December 24th 2015)

500 Sector Performance 12 24 2015

When a full year of data is available it will be important to consider the impact of volatility in each asset class by comparing the Risk Adjusted Returns within each sector.


The posts on this blog are opinions, not advice. Please read our Disclaimers.