Get Indexology® Blog updates via email.

In This List

The Rieger Report: Apple Inc.: Stock & Bonds Move on Different Tracks

Looking for Incremental Yield

European Bond Markets Closing 2015 on Steady Ground, But Needs to Watch Its Step

The Rieger Report: Municipal Bond Market Winners and Losers Through Dec. 17 2015

Floating Securities in Advance of Rising Rates

The Rieger Report: Apple Inc.: Stock & Bonds Move on Different Tracks

Contributor Image
J.R. Rieger

Former Head of Fixed Income Indices

S&P Dow Jones Indices

We all know stocks and bonds are rarely correlated.  The recent steep decline in the price of Apple Inc. stock illustrates this vividly.  Since the end of November the price of Apple Inc. stock has fallen by over 10%.  Apple has also become one of the larger U.S. corporate bond issuers.  Those bonds have barely moved during this time period.

As of December 18th 2015:

  • Apple Inc bonds in the S&P 500 Bond Index represent over $36.9billion in market value.
  • These bonds represented just under 1% of the bonds in the index (as measured by market value).
  • There are 18 different Apple Inc. bond issues in the S&P 500 Bond Index.
  • The weighted average bond price of Apple bonds in the index was 94.4 verses 94.7 at the end of November.
  • The  weighted average yield to worst (YTW) of Apple bonds in the index was 2.5% verses 2.48% at the end of November.

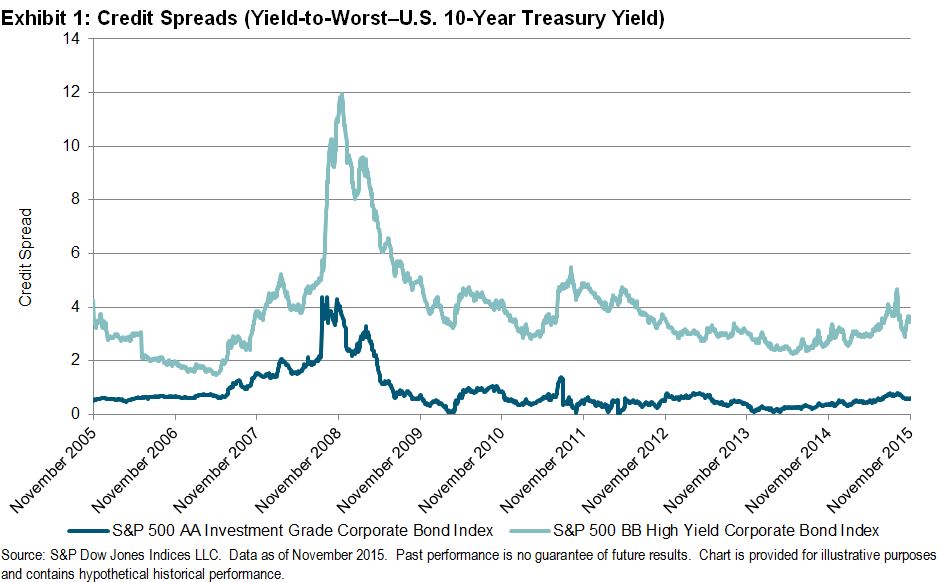
The investment grade U.S. corporate bond market tracked in the S&P 500 Investment Grade Corporate Bond Index has had a modest negative return of 0.29% month-to-date so Apple bonds appear to be moving in line with the rest of the bond market.

The S&P 500 Bond Index tracks the fixed rate debt of the blue chip issuers in the iconic S&P 500 Index.

The posts on this blog are opinions, not advice. Please read our Disclaimers.

Looking for Incremental Yield

Contributor Image
Lucas Chiang

Associate, Product Management

S&P Dow Jones Indices

Over the past few years, corporations have taken advantage of the low interest rate environment and have thereby increased the size of the corporate bond market considerably.  Many of these bonds, however, are subject to the effects of rising interest rates.  In fact, anticipation of this change in interest rates alone has already started to shake parts of the market.

Credit spreads—the difference between the yield on a corporate bond and the yield on a treasury security of similar maturity—can be viewed as a reflection of the risk of default.  Typically, wide corporate credit spreads indicate a riskier lending environment, as bondholders generally will only take on a greater risk of default in exchange for a greater yield.  As the economy grows and companies’ financial health improves, credits spreads tend to narrow.

In examining the subparts of the S&P 500® Bond Index, we can take a deeper look at how credit spreads have changed for AA- and BB-rated corporate bonds issued by constituents of the S&P 500.  Until recently, credit spreads had been narrowing to unusually tight levels over the past several years; low interest rates had starved fixed income investors from the yields available in years past.  However, in recent months, there has been a widening of credit spreads in spite of low rates.  In 2014, AA spreads ranged from 0.09% to 0.43%, while BB spreads ranged from 2.26% to 3.37%.  In 2015, AA spreads ranged from 0.30% to 0.81%, while BB spreads ranged from 2.55% to 4.67%.  Tight spreads meant that bonds cost more and yielded less.  So, with the prospect of a greater payoff, this low-rate environment has become increasingly attractive to investors.  The demand for incremental yield has started to outweigh the traditional risk/return model in the corporate bond market, as investors have begun taking on a relatively high amount of risk for a relatively low amount of incremental yield.

Capture

The posts on this blog are opinions, not advice. Please read our Disclaimers.

European Bond Markets Closing 2015 on Steady Ground, But Needs to Watch Its Step

Contributor Image
Heather Mcardle

Director, Fixed Income Indices

S&P Dow Jones Indices

After much anticipation, the US Fed hiked rates 25bps on Wednesday.  The US Fed indicated further moves would be dependent on global factors and oil prices – a key detail signifying that future rate hikes seem likely to develop on a slower scale, causing a European government bond market rally on Thursday, sending yields lower in the region.  This is quite a different result than earlier this year, when European bond market bonds sold off in fear that a Fed rate hike would lead to a shift away from European government bond markets to the higher yields and high quality of the US government bond market.  On Thursday, European government bond market yields moved lower with the S&P U.K. Gilt Bond Index tightening 10bps, the S&P Greece Sovereign Bond Index tightening 18bps, and most other European government bond market yields tightening around 5bps. (See table below).

Performance levels year-to-date vary across Europe.  On the higher end, it’s with no surprise that while Greece had a rocky road, high risks are met with high rewards.  The S&P Greek Sovereign Bond Index ytd performance is 21.95%.  The S&P Italy Sovereign Bond Index ytd return performance is 4.27% and the S&P Portugal Sovereign Bond Index ytd performance is at 3.48%.  The S&P Switzerland Sovereign Bond Index comes in at 3.25% performance ytd, while the S&P Germany Sovereign Bond Index has a 0.73% ytd performance.

Since the beginning of the year, yields in the region are largely ending up higher, with a few exceptions.  (See table below).  2015 saw considerable volatility with back and forth movement between risk and safety, as well as the launch of the ECB’s QE program.  S&P Greece, Ireland, Italy and Luxembourg Sovereign bond indices yields are lower.  (See table below).

European bond markets will be keeping a close eye on global factors, as a pick up in the US fed rate hike policy could significantly change Europe’s steady ground, and ultimately hurt a sluggish economy.

Capture

The posts on this blog are opinions, not advice. Please read our Disclaimers.

The Rieger Report: Municipal Bond Market Winners and Losers Through Dec. 17 2015

Contributor Image
J.R. Rieger

Former Head of Fixed Income Indices

S&P Dow Jones Indices

Some parts of the U.S. municipal bond market is doing well in 2015 but others are struggling.  Let’s start with which states are hot and which are not.   Guam is the leader but that tiny issuer is really not a far measure.  Smaller issuers like municipalities in Iowa, North Dakota have done well and supply may play a factor.  Underperformers have been led by Puerto Rico.  The S&P Municipal Bond Puerto Rico Index is down 8.6% year-to-date.  Despite the negative headlines about pension shortfalls Illinois and New Jersey bonds are both are underperforming the overall bond market but not by all that much.   By comparison the investment grade tax-free muni market tracked in the S&P National AMT-Free Municipal Bond Index is up 2.98%.

State Performance 12 17 2015

Sectors of the municipal bond market outperforming include the much tobacco settlement bond sector up 11.8% year-to-date.  These bonds have huge obligations in the future but they often are long dated so the short term risks are very different then the long term prospects of repayment.  Healthcare related sectors of the bond market have outperformed the rest of the market as well.  Underperforming is the defaulted sector down nearly 3.8% but what is extremely telling is the performance of the U.S. Government Bond backed Prerefunded and Escrowed to Maturity sector.  These bonds have done little in 2015 due to the low yields of these high quality and often short term bonds.

Sector Performance 12 17 2015


The posts on this blog are opinions, not advice. Please read our Disclaimers.

Floating Securities in Advance of Rising Rates

Contributor Image
Lucas Chiang

Associate, Product Management

S&P Dow Jones Indices

This Wednesday, the Fed announced that they would begin raising rates, a decision that has left many investors with questions about how they will fare in this changing environment.  Knowing that conventional, fixed-rate securities sometimes lose value when interest rates increase has some investors looking to floating-rate securities instead.  Floating-rate securities are designed to mitigate interest rate risk by regularly adjusting to keep pace with the movements of short-term rates.  In short, that means floating-rate securities should exhibit minimal price sensitivity to changes in interest rate levels.  To see how floating-rate securities have performed in anticipation of this announcement, we will take a look at examples in the preferred stock and senior loan markets over the last year.

Preferred stock is a class of capital stock that generally pays dividends determined by a fixed rate, variable rate, or a floating rate.  The S&P U.S. Preferred Stock Index comprises preferred shares of each dividend payment type.  When comparing the S&P U.S. Preferred Stock Index to the S&P U.S. Floating Rate Preferred Stock Index, we can observe that while both have positive returns, floating-rate stocks have outperformed stocks that are more interest rate sensitive by 2.71% in the past one-year period (see Exhibit 1).

Capture

The preferred stock example helps us understand why there is an expectation for floating-rate securities to perform well given this environment.  However, the senior loan market’s underperformance this year has shown that floating rates act as protection from only one of many confluent pressures.  Senior loans have felt the detrimental effects of supply outpacing demand most months this year.  New issuances have expanded the overall size of the market, while retail investors continue to be net sellers of loans on the year.  According to S&P Capital IQ LCD, institutional and retail allocations alike have stalled in response to volatility in the broader markets and are likely refraining from shifting capital back in until it is clear the Fed intends to consistently raise rates through 2016.  Consequently, the S&P/LSTA Leveraged Loan 100 Index has taken a -1.55% hit YTD, demonstrating that floating-rate securities can actually sink in a rising rate environment and even underperform fixed-rate securities.

Capture

Capture

The posts on this blog are opinions, not advice. Please read our Disclaimers.