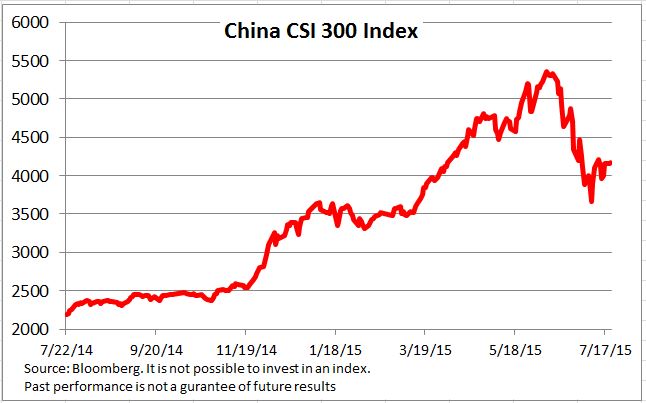
The yield-to-worst of the S&P/BGCantor Current 10 Year U.S. Treasury Index closed out the week of July 17, 2015, at 2.35%, which was 6 bps lower than the previous Friday’s 2.40% close. The 2.40% close on Friday, July 10, 2015, came in after a quick two-day increase, as the yield-to-worst jumped 10 bps on Thursday, July 9, 2015, and another 10 bps on that Friday. The jump up in yield was due the unwinding of safety trades after the Chinese stock market recouped losses, along with optimism about a Greek bailout.
Friday, July 17, 2015, saw prices increase, pushing yields lower. Slow growth in inflation, as evidenced by the June CPI number, which was 0.3% versus 0.4% in May, moved yields down. The Federal Reserve’s continued data-dependent approach to a possible rate increase has investors questioning the timing of any action, given that a rate increase is dependent on the economy meeting the Fed’s economic growth projections. The S&P/BGCantor Current 10 Year U.S. Treasury Index has returned 0.19% MTD and has lost 0.09% YTD as of Friday, July 17, 2015.
As of the same date, the S&P 500® Bond Index has been close to flat for the month, having returned -0.01% and -0.65% YTD. The index was launched on July 8, 2015, at which point it returned 0.73% MTD. The dramatic selling in bonds that occurred on July 9-10, 2015, took the return down to as low as -0.49% MTD before the index worked its way back up to be almost flat to close the week.
The investment-grade segment of the S&P 500 Bond Index (the S&P 500 Investment Grade Corporate Bond Index) experienced the same dip and recovery, as its returns went from 0.79% MTD on July 8, 2015, to -0.55% MTD on July 13, 2015. The index then recovered to -0.04% MTD on July 17, 2015, to close the week. Year-to-date, this index has returned -0.86% as of July 17, 2015.
The S&P 500 High Yield Corporate Bond Index, a subindex of the S&P 500 Bond Index, has 440 issues and a yield-to-worst of 4.98% as of July 17, 2015. The S&P 500 High Yield Corporate Bond Index has returned 0.28% MTD and 1.64% YTD as of the same date. Although it has not returned 3.41% YTD like the much broader S&P U.S. High Yield Corporate Bond Index, the S&P 500 High Yield Corporate Bond Index is beating the broader index’s 0.08% MTD as of July 17, 2015.
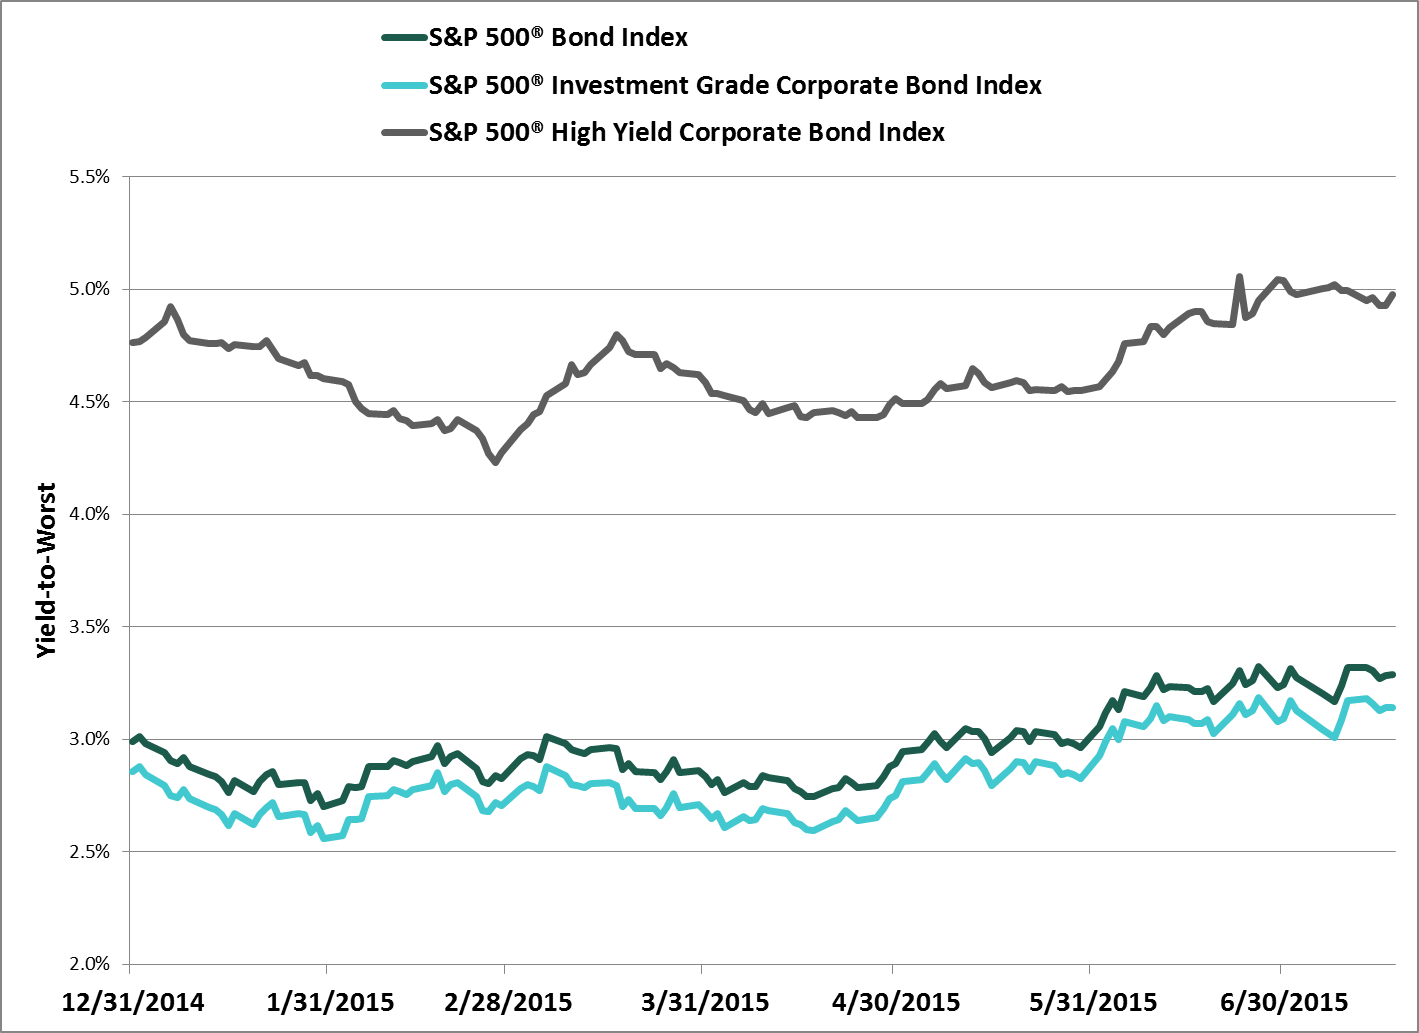
Source: S&P Dow Jones Indices LLC. Data as of July 17, 2015. Past performance is no guarantee of future results. Chart is provided for illustrative purposes.
The posts on this blog are opinions, not advice. Please read our Disclaimers.