Get Indexology® Blog updates via email.

In This List

Selling Oil Won't Feed Iran

The Impact of Currency Exposure: Evidence From the Performance of Actively Managed Global Equity and Bond Funds

Forget China: A Little Greece Goes A Long Way

An Index Provider’s Perspective on the Growing Australian ETF Market

Credit Default Spreads…Moving On Up

Selling Oil Won't Feed Iran

Contributor Image
Jodie Gunzberg

Former Managing Director, Head of U.S. Equities

S&P Dow Jones Indices

Now that negotiators have reached a deal aimed at reining in Iran’s nuclear program, Iran may get relief from some sanctions that may allow it to raise oil output. Though it could take time for supply to come onto the market, it depends on how long it takes for the International Atomic Energy Agency (IAEA) to verify all necessary nuclear-related actions have been met. Also, while oil in floating storage could come to market quickly (roughly 180 kb/d for 6 months according to IEA) and oil from already developed fields might be easier to deliver, underinvestment in production capacity and further negotiations of foreign investment from global oil companies may delay additional supply for significant time. It is extremely difficult to estimate future Iranian output not only from their own variables but based on how other suppliers will react to the news to maintain their market share ahead of Iran’s return.

The magnitude and direction of oil after Iranian supply comes to market is unknown. When less is known, volatility generally picks up as has happened in past oil crises. Also historically, open interest has had to crash before oil stabilized. Not only may OPEC’s last decision to continue production backfire from fund managers cutting their bets, but recent trade data from the Commodity Futures Trading Commission (CFTC) shows speculators have made their sharpest crude selloff in more than two and a half years. This is a critical point because the open interest is now at its lowest monthly peak in 2015. Also, the open interest has historically dropped about 1/3 before volatility normalized and now the numbers are showing the drop from roughly 500,000 to 300,000. This may be an inflection point indicating market rebalancing may be in its early stages.

Inflection Point Crude

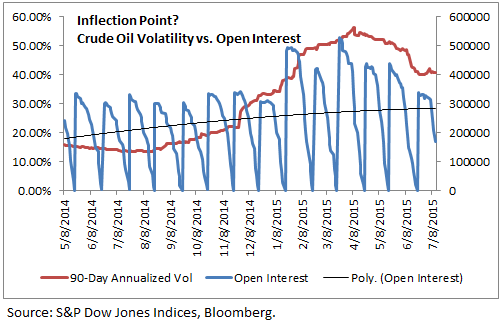
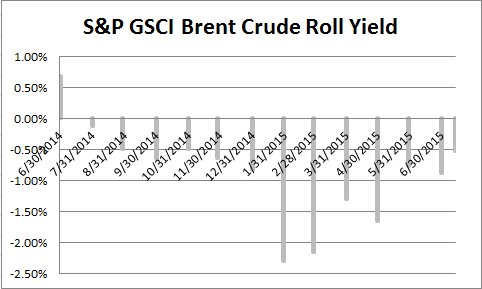
Although the open interest may be collapsing now to initiate the start of the bottoming process, there is trouble for Iran. The timing is terrible because oil has continued to be supplied in excess (as shown below by the negative roll yields from contango) since July 2014. As they re-enter the market, it may cause more downward pressure on oil prices, limiting the upside on their revenue.

Source: S&P Dow Jones Indices

A consequence of Iran’s lower potential revenue is that it may hinder its ability to import healthy food to feed its population. Since its climate is not ideal for production, and is warming, Iran is food insecure and needs to rely heavily on imports. Iran imported $214 million worth of wheat in 2013 with other major imports including corn, soybeans and meat but malnutrition and obesity has risen as imports of cheaper sugar (DJCI Sugar lost 14.1% YTD as of July 13, 2015) have replaced many fruits and vegetables.

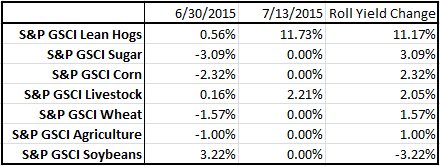
The concurrent glut of oil as Iran re-enters the market with the agricultural and livestock term structures that are now showing shortages can work against the budget both ways. This is particularly bad timing as contango (shown as negative) is now flipping towards backwardation (shown as positive) in these commodities – with the exception of soybeans:

Source: S&P Dow Jones Indices

Even worse for Iran is that importing food may be more expensive than ever due to the highly predicted El Niño. Agricultural prices have been increasing at an accelerated pace with each El Niño since 1982 by roughly 2.6% with large possible spikes following the heat waves.

The posts on this blog are opinions, not advice. Please read our Disclaimers.

The Impact of Currency Exposure: Evidence From the Performance of Actively Managed Global Equity and Bond Funds

Contributor Image
Aye Soe

Former Managing Director, Global Head of Core and Multi-Asset Product Management

S&P Dow Jones Indices

In the past 18 months, currency hedging has become one of the hottest topics in the investment community.  As the U.S. economy strengthens and decouples from the rest of the developed and emerging economies, and as there is unprecedented quantitative easing by the Bank of Japan and the European Central Bank, it is nearly inevitable that the U.S. dollar will rally strongly against other major currencies.  The movement into currency-hedged, passive investment products has been  strong, as investors seem to be looking at their non-USD exposure.

For a USD investor, currency hedging has long been part of fixed income portfolio management, as currency volatility plays a significant role in international bond returns.  However, it is not as prevalent in equity investing.[1]  That has been changing as the spreads between hedged international equity portfolios and unhedged international equity portfolios has widened considerably in recent months, and they may widen even more, all else being equal, if other major currencies continue to weaken relative to the U.S. dollar.[2]  For example, the S&P Global Ex US LargeMid BMI Index returned -3.02% in 2014, while its USD-hedged counterpart delivered 6.04% during the same period, representing over 900 bps in performance differential.

The impact of currency hedging has investment implications beyond just returns and volatility.  Those that are tasked with evaluating managers can observe that during periods in which the U.S. dollar is increasing, a manager’s decision to hedge or not to hedge the currency exposure could mean the difference between underperforming and outperforming, depending on the benchmark used.  This can be noted in the relative out/underperformance percentages of actively managed international equity funds and fixed income funds against their respective USD-hedged and unhedged benchmarks over the past 12 months ending Dec. 31, 2014 (see Exhibits 1 and 2).

In 2014, over 77% of actively managed U.S. funds invested in international equities underperformed their respective unhedged benchmarks.  The figure is worse when compared with the USD-hedged version, with 100% of the managers underperforming it.  Similarly, in the area of fixed income, only 36% of global income managers underperformed the unhedged benchmark.  However, when compared against the returns of a hedged benchmark, an overwhelming number (91%) underperformed.

The stark difference in performance between those managers, depending on the benchmark used, highlights the potential need for investors to consider currency management in the near to medium term when it comes to international investing.  While it can be argued that the currency hedging decision is one of active management that should be left to professional investors who can make those calls based on macroeconomic conditions, investors allocating capital to active managers may need to dig deeper and understand what type of returns they may be getting.  In addition, they must carefully consider what an appropriate benchmark should be for those international investment returns.  Comparing the returns of a hedged portfolio with those of an unhedged benchmark may not be an apples-to-apples comparison, as the active currency bets that the managers are taking are not captured in the unhedged benchmark returns.

Capture

Capture

[1] To be fair, the decision to not hedge the currency exposure in international equities during the past decade had a lot to do with the weak U.S. dollar against major currencies.

[2] Over the long term, hedged and unhedged international equity portfolios have tended to perform similarly.

The posts on this blog are opinions, not advice. Please read our Disclaimers.

Forget China: A Little Greece Goes A Long Way

Contributor Image
Jodie Gunzberg

Former Managing Director, Head of U.S. Equities

S&P Dow Jones Indices

According to CNN Money, China’s stock market just lost about $3.25 trillion. That is the equivalent of more than the size of France’s entire stock market, about 60% of Japan’s market, and twice the size of India’s stock market. Despite the seemingly large size, the Chinese stock market still plays a surprisingly small role in China. According to The Economist, “the free-float value of Chinese markets—the amount available for trading—is just about a third of GDP, compared with more than 100% in developed economies. Less than 15% of household financial assets are invested in the stockmarket: which is why soaring shares did little to boost consumption and crashing prices will do little to hurt it. Many stocks were bought on debt, and the unwinding of these loans helps explain why the government has been unable to stop the rout. But this financing is not a systemic risk; it is just about 1.5% of total assets in the banking system.”

Additionally, according to the latest report by the International Energy Agency (IEA), robust growth has been seen across the Chinese (oil) product spectrum recently with higher-than-expected refinery activity. While the near 3% annual gain foreseen (IEA) for Chinese oil demand in 2015-16 is down from the double-digit percentage point gains seen only a few years back, demand is still 11.13 million barrels per day.

Source: Oil Market Report, International Energy Agency. July 2015

So, forget about China.

However, Greece is delivering a double whammy to oil. The dispute between Greece and European leaders is depressing the euro, and whenever the euro gets depressed, the U.S. dollar gets relatively stronger and commodity markets suffer. While not all commodities fall with a stronger dollar, the five commodities of the petroleum complex have the greatest inverse sensitivity, ranging from -0.62 to -0.67.

If Greece were to exit the euro, any replacement currency it adopts may be severely debased; bringing additional downside pressure to Greek oil product demand as products become more expensive from a stronger U.S. dollar. The IEA cites a recent study of crisis-hit exchange rate regime changes by JPMorgan that concluded that the average depreciation in the first year of trading is between 40% and 80% versus the US dollar. Argentina, for example, saw 70% wiped off the value of the peso in 2002 alongside contractions of 10.9% in GDP and 8.6% of oil product demand. According to the IEA, a similarly sized contraction in Greece in 2016 would remove a further 15 kb/d. That may not seem like much but if Greece’s economic woes spill over into other EU countries, it may curtail oil demand growth across the region, and Europe’s demand is projected by the IEA to be greater than China’s at 13.52 million barrels per day.

Not only is the Greek debt crisis strengthening the U.S. dollar, but the unemployment and frozen banking system is also weakening oil demand. The recent imposition of daily cash withdrawal limits and refusals of credit cards at petrol stations will likely limit access to oil products. In simple terms, if the Greeks can’t pay for gas, there is no demand.

The posts on this blog are opinions, not advice. Please read our Disclaimers.

An Index Provider’s Perspective on the Growing Australian ETF Market

Contributor Image
Shaun Wurzbach

Managing Director, Head of Commercial Group (North America)

S&P Dow Jones Indices

The Exchange Traded Fund (ETF) landscape in Australia continues to grow and mature in assets under management (AUM) and in number of ETF products offered. As of June 2015, the Australian ETF Market was reported to be at A$18.1 Billion in AUM and 107 ETFs traded on the ASX. As an index provider with deep roots in the Australian market, S&P Dow Jones Indices takes interest in this, because Exchange Traded Funds which are index-trackers are the delivery vehicles of index effectiveness and index-based innovations.

Index Effectiveness*: One way to judge if an index is effective is to determine if it measures an asset class or a market in an investible manner. For years, S&P DJI has conducted analysis and published a research report named S&P Index vs Active, or SPIVA®. The purpose of the SPIVA report is to compare the field of actively managed mutual funds against an apples-to-apples index benchmark in size and style. We now calculate SPIVA for several markets, including Australia. Here are some of the latest results for Australia:

Capture

With our index benchmarks demonstrating that they are hard for many actively managed mutual funds to beat (with the notable exception of Australian Small-Cap), we conclude that indices are effective in measuring markets and asset classes, which can be accessed by ETFs that track these indices.

Index-based Innovations: Indexing measures international markets and asset classes beyond Australia’s shores. One of the presenters at our recent 5th Annual ETF Masterclass in Sydney and Melbourne said that “Australians may be the champions of home bias.” Several International ETFs list in the Australian market, providing the means to mitigate the risks of that home bias. The largest of these by size are tracking the S&P 500® index, measuring Large-Cap U.S. companies. Indices and the ETFs tracking them in Australia have also advanced to cover asset classes beyond equities. The Australian ETF market now offers ten fixed income ETFs which are index-trackers. Two of those, issued by State Street Global Advisors, are tracking S&P DJI fixed interest indices. Real Assets such as Real Estate and Commodities are covered by indices and there are a number of these available now as ASX-listed ETFs. You might expect to see Australian ETFs in the future covering infrastructure equity and debt Indices or other real assets that were formerly only accessible to institutional investors in illiquid ways. In this manner, the growth and advance of the Australian ETF market will democratize access to financial solutions.

The latest index-based innovations may be found in what some are calling smart beta indices. From an indexing perspective, smart beta may be partially described as an index designed to deliver a particular factor (value, quality, momentum, etc.) or an index which alternatively weights an asset class or both those features at the same time. In the Australian ETF Market, these smart beta strategies may be managed fund ETFs.  A new ETF product provider to the Australian market, ANZ ETFS has announced the launch and listing of two new smart beta ETFs which are index-trackers: one of these ETFs tracks the S&P 500 High Dividend Low Volatility Index, the other tracks the S&P/ASX 300 Shareholder Yield Index.

We judge that indexing effectiveness and indexing innovation may be beneficial for financial markets. However, as the Australian ETF market grows in number of ETF offerings and the complexity of these ETF offerings, an increasing burden of due diligence is placed on Aussie planners, wealth managers, and institutional investors who seek to benefit from what ETFs may offer.   As the index provider for 39% of these ETFs by number and 65% by AUM (please see table below), we believe that we have a part to play in the education component of that due diligence.

Capture

By education, I specifically mean that we are in the position to share with you how index construction and other index rules and characteristics matter to the ETF tracking them. To that end, we can also share index historical performance data and analysis on that performance as a further guide to those seeking a better understanding of ETFs. An example of this type of education is “Why Does the S&P 500 Matter to Australia.” Also, a current list of S&P Dow Jones Indices which have been licensed by ETF providers and listed on the ASX may be found on spdji.com.

*A general (or working) definition of Index effectiveness is an index benchmark constructed to have investible characteristics, consistency in style and size, index historical performance in SPIVA which typically outperforms the majority of actively managed mutual funds in the same asset class, and the persistence to typically be above average over 3 and 5 year measurement periods when plotted against actively managed funds.

The posts on this blog are opinions, not advice. Please read our Disclaimers.

Credit Default Spreads…Moving On Up

Contributor Image
Tyler Cling

Senior Manager, Fixed Income Indices

S&P Dow Jones Indices

The S&P/ISDA U.S. 150 Credit Spread Index has seen spreads widen by 56.52% since July 2014. This means investors are demanding over 50% more on the notional cost of default insurance on the largest investment-grade corporate bonds tracked by the S&P 500®. CDS “insurers” from the S&P/ISDA CDS U.S. High Yield OTR Index saw spreads widen only 26.07% in the past 12 months, with the major discrepancy coming in 2015. The YTD change in spreads is roughly 10 times higher for investment-grade CDS spreads than high yield…however this only tells half the story.

Capture

The cost of default insurance for the S&P/ISDA CDS U.S. High Yield OTR Index still costs more than 4.5 times as much as for the S&P/ISDA CDS U.S. Investment Grade OTR Index, as protection on a loan of USD 1 million would cost USD 32,400 and USD 7,200, respectively. The important takeaway is that tumbling investor sentiment is not reserved for the high-yield sector, and this may not bode well for the equity market. Examining the trend for each index since March 2015, spreads are moving only one way…up.

Capture

The posts on this blog are opinions, not advice. Please read our Disclaimers.