Get Indexology® Blog updates via email.

In This List

Show Me The Muni: Q2 2015

The U.S. Celebrates its Independence While Greece Displays its Dependence on Debt

Manufacturing: India needs it to spur its growth rate

Asia Fixed Income: People’s Bank of China (PBoC) Rate Cuts

Inside the S&P 500®: Stocks, Not Indices, Move Markets

Show Me The Muni: Q2 2015

Contributor Image
Tyler Cling

Senior Manager, Fixed Income Indices

S&P Dow Jones Indices

The S&P Municipal Bond North Dakota Index (0.47% QTD) was the only U.S. state or territory index to finish the second quarter in the black.  The bonds tracked by the S&P Municipal Bond Puerto Rico Index (-8.22% QTD) have been in the focus of the mainstream media this week following public statements from their governor that the island territory cannot meet their USD 72 billion in outstanding debt obligations.  Since Governor Padilla declared the commonwealth’s debt “not payable” on Monday, June 29, 2015, the total return on Puerto Rico muni debt has fallen 7.2%, with the YTW spiking to 9.82%.

Capture

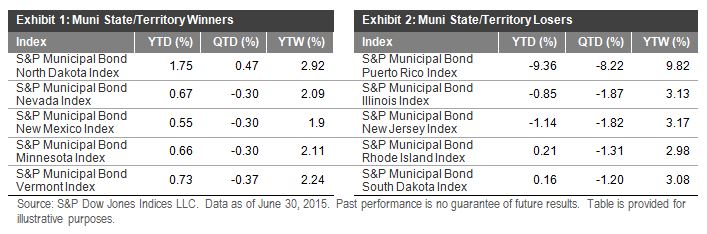
The S&P Municipal Bond Puerto Rico General Obligation Index, which includes debt from the Puerto Rico Electric Power Authority (PREPRA), fell 7.85% in 48 hours, with the YTW finishing the quarter at 11.67%.  Investors who had been enjoying high yields throughout the Puerto Rico muni saga are finally shoving off the island to safer shores.

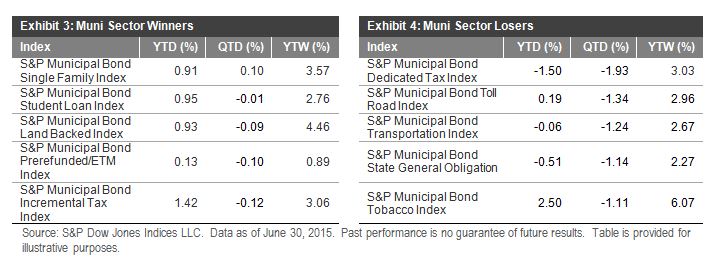
The S&P Municipal Bond Single Family Index, which tracks single-family housing debt, was the only sector-based muni index to finish the quarter in the black, returning 0.10% QTD.  In contrast, the S&P Municipal Bond Dedicated Tax Index, which features property, sales, excise, service, motor, etc., was down 1.93%.  The highest-returning sector in Q1 2015, the S&P Municipal Bond Tobacco Index (3.66% Q1 2015), joined dedicated tax municipals on this quarter’s loser list after falling 1.11% in Q2 2015, shaving the YTD return to 2.50%.

Capture

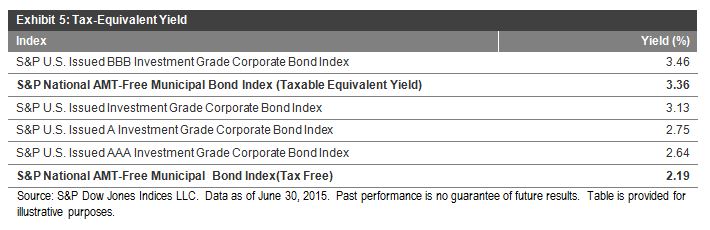
When examining yields and returns on tax-free municipals, it can be important to consider the tax benefit.  The investment-grade issues in the S&P National AMT-Free Municipal Bond Index have a tax-equivalent yield of 3.36%, which is superior to the S&P U.S. Issued Investment Grade Corporate Bond Index yield of 3.13%.

Capture

The posts on this blog are opinions, not advice. Please read our Disclaimers.

The U.S. Celebrates its Independence While Greece Displays its Dependence on Debt

Contributor Image
Kevin Horan

Former Director, Fixed Income Indices

S&P Dow Jones Indices

Closing out a short week before the U.S. fourth of July holiday, the yield-to-worst of the S&P/BGCantor Current 10 Year U.S. Treasury Index closed at 2.38% on Thursday, July 2, 2015.  The yield-to-worst was 9 bps lower than the 2.47% close of the previous Friday (June 26, 2015), as concerns over the Greek bailout vote on July 5, 2015, moved some investors to the safety of treasuries.  The index lost 1.86% for June, and it was down 0.26% for the first two days of July.  The YTD return of the index has been in negative territory since June 3, 2015, and the index had returned -0.54% YTD as of July 2, 2015.

The past week’s news affected the S&P U.S. Investment Grade Corporate Bond Index similarly, as the yield-to-worst closed before the holiday at 3.19%, 3 bps lower than the previous Friday’s 3.22%.  Investment-grade yields followed U.S. Treasury yields lower, as investors reacted to continued information about the negotiations between Greece and its creditors.  The index closed out June down 1.53%.  For the beginning of July, the index had returned -0.25% MTD and -0.71% YTD as of July 2, 2015.

High-yield issuance was slow before the holiday weekend, as two smaller deals came to market, pricing on June 30, 2015.  SS&C Technologies Inc. issued USD 600 million of an eight-year bond with a coupon of 5.875%.  The second deal was issued by DAE Aviation Holdings and was USD 485 million of an eight-year bond with a coupon of 10%.  High-yield bonds, as measured by the S&P U.S. High Yield Corporate Bond Index, lost 1.41% in June, but the index had returned 0.25% for the first two days of July and 3.58% YTD.

Unlike the high-yield index’s -1.41% slide in June, the S&P/LSTA U.S. Leveraged Loan 100 Index was down for the past month, but by only 0.86%.  As of July 5, 2015, the index had returned 0.15%, while it was returning 1.91% YTD.
Index Return Comparison

Source: S&P Dow Jones Indices LLC.  Data as of July 2, 2015.  Leverage loan data as of July 5, 2015.  Past performance is no guarantee of future results.  Table is provided for illustrative purposes.

The posts on this blog are opinions, not advice. Please read our Disclaimers.

Manufacturing: India needs it to spur its growth rate

Contributor Image
Mahavir Kaswa

Former Associate Director, Product Management

S&P BSE Indices

MACRO-ECONOMIC OVERVIEW: 

Over the last couple of decades (1994-2013), China noted an average GDP growth rate of 10%, while India noted an average GDP growth rate of a little less than 7% during the same period.  However, over past few years, China has noted a steady decline in its growth rate.  If the estimates of the International Monetary Fund (IMF) are to be believed, India is soon expected to become the fastest-growing large economy in the world.

Exhibit 1: GDP Growth Rate – IMF Database: Measured in Constant Prices (Local Currency)

gdp

Source: IMF, World Economic Outlook Database, www.imf.org.  Data as of April 2015.  Chart is provided for illustrative purposes.

Historically, India’s growth has been primarily lead by a boom in the services sector, which contributed 47.4% to India’s GDP in 2013 (increasing from 41% in 1994).  “Others”[1] was the second-largest contributor to India’s GDP, which contributed 36.7% to India’s GDP in 2013.  Gains noted by the services sector was at the expense of the “others” category, which has noted declining GDP contribution numbers over past 20 years.  Manufacturing has consistently been the smallest contributor to India’s GDP, ranging between 13%-17%; the sector’s contribution in 2013 was 15.9% of GDP.

China has also noted a similar level of contribution to its GDP by the services sector as India, as well as a similar steady decline of the “others” sector in its contribution to its GDP.  However, unlike India, China has traditionally experienced a higher GDP contribution from the manufacturing sector.  In order to spur its GDP growth rate, India may need to increase the contribution of the manufacturing sector to GDP.

ex 2

Source: World Bank, http://www.worldbank.org.  Table is provided for illustrative purposes.

[1] “Others” is plug figure, and it includes anything other than services and manufacturing; it also includes agriculture and other small industries/sectors.

Exhibit 3: Sector Contributions to GDP by Country 

ex 3

Source: World Bank, http://www.worldbank.org.  Data as of year-end 2013.  Charts are provided for illustrative purposes.

At present, India appears to be in a sweet spot of the economic cycle, with a recent fall in major commodities prices (including crude oil), resultant low inflation, reductions in the key interest rate by the Reserve Bank of India (RBI) (there has been a total reduction of 75 bps in interest rates).  Also contributing to recent economic success in India are the government’s renewed efforts to boost the economy by way of economic reforms, a low current account deficit, and positive sentiments by  global and domestic investors due to all of the aforementioned factors.

India also has a large pool of young hands with good skill sets.  This, combined with low commodities prices (including crude oil), low inflation, and low interest rates, is conducive for the growth of the manufacturing sector.  Manufacturing has great potential for direct and indirect job creation, and it may help to create a strong middle class population—a must for any strong economy.  With the unveiling of the National Manufacturing policy in 2011, India has set an ambitious goal to increase the contribution of the manufacturing sector to 25% (from the level of less than 17% in 2011) in order to help create 100 million jobs by 2022.

S&P BSE INDIA MANUFACTURING INDEX:

The S&P BSE India Manufacturing Index is a first-of-its-kind equity index in India.  The index is designed to measure the performance of the top 30 liquid and investable companies in production and manufacturing activities in the country.

The constituents are selected from the S&P BSE LargeMidCap, a sub-index of the S&P BSE AllCap.  Issues eligible for inclusion are common stocks with a listing history of at least six months.  Each stock must be issued by a company that is identified as part of the manufacturing and production BSE Industry Sub-Groups, which are listed in the index methodology.  The index is calculated in real time.

The S&P BSE Manufacturing Index is diversified, with the maximum weight of a sector being capped at 30% and the maximum weight of an individual stock being capped at 10%.  The index is reconstituted semi-annually, in March and September, and index values are available in Indian rupees and the U.S. dollar; the first value date of the index goes back to Sept. 16, 2005.

INDEX PERFORMANCE CHARTS AND TABLES:

Exhibit 4: Index Performance Since Inception: 

ex 4

Source: Asia Index Private Limited.  Returns used are total returns in INR.  Data from September 2005 to May 2015.  Symbol ‘~’ denotes partial caledar year returns.  First value date of the S&P BSE India Manufacturing Index is Sept. 16, 2005.  It is not possible to invest directly in an index.  Past performance is no guarantee of future results.  Charts are provided for illustrative purposes and reflect hypothetical historical performance.

ex 5

Source: Asia Index Private Limited.  Returns used are total returns in INR.  Data from September 2005 to May 2015.  Symbol ‘~’ denotes partial caledar year returns.  First value date of the S&P BSE India Manufacturing Index is Sept. 16, 2005.  It is not possible to invest directly in an index.  Past performance is no guarantee of future results.  Table is provided for illustrative purposes and reflect hypothetical historical performance.  Please see the Performance Disclosures at the end of this document for more information regarding the inherent limitations associated with back-tested performance.

Exhibit 6: Risk/Return Profile

ex 6

Source: Asia Index Private Limited.  Returns used are total returns in INR.  Data from September 2005 to May 2015.  First value date of the S&P BSE India Manufacturing Index is Sep. 16, 2005.  It is not possible to invest directly in an index.  Past performance is no guarantee of future results.  Charts are provided for illustrative purposes and reflect hypothetical historical performance.  Please see the Performance Disclosures at the end of this document for more information regarding the inherent limitations associated with back-tested performance.

Exhibit 7: Sector Weights

ex 7

Source: Asia Index Private Limited.  Data as of May 29, 2015.  Chart is provided for illustrative purposes.

HOW COULD THE S&P BSE INDIA MANUFACTURING INDEX HELP INVESTORS?

The S&P BSE India Manufacturing is a thematic index, and historically, the manufacturing theme has been cyclical in nature.

We have few tools that measure manufacturing activities in India, such as the Index of Industrial Production (IIP), the HSBC India Manufacturing PMI, or the SBI Composite Index; however, these tools don’t measure share price performances and are not investable.  The S&P BSE India Manufacturing Index may complement all of these indices, as it is designed to measure the equity share price performance of companies generating revenue from manufacturing and production activities.  The design of the index takes care of investability, and the index is likely suitable for low-cost investment products such as ETFs or index funds.

The posts on this blog are opinions, not advice. Please read our Disclaimers.

Asia Fixed Income: People’s Bank of China (PBoC) Rate Cuts

Contributor Image
Michele Leung

Former Director, Fixed Income Indices

S&P Dow Jones Indices

On June 28, 2015, the PBoC announced a 25 bps policy rate cut and a 50 bps targeted reserve ratio cut to support growth. Following the news, the money market rate opened lower and the yuan weakened. While there was no significant or immediate impact on China’s onshore bond market, the yield-to-maturity tracked by the S&P China Sovereign Bond Index continued its tightening trend seen in 1H 2015, dropped 48 bps to 3.08%, as of June 29, 2015. On the other hand, its total return added 0.56% in June, bringing its YTD return to 2.87%.

The S&P China Corporate Bond Index outperformed the S&P China Sovereign Bond Index and gained 4.26% YTD, and its yield-to-maturity tightened by 110 bps to 4.26% as of June 29, 2015—a level last seen in late 2010.

Looking at the country level, the S&P China Bond Index rose 3.24% YTD as of June 29, 2015, compared to the 1.95% YTD gain of the S&P Pan Asia Bond Index, which tracks the performance of local-currency-denominated government and corporate bonds from 10 countries in the Pan Asia region. The yield-to-maturity of the S&P China Bond Index tightened by 67 bps to 3.63% in the same period.

Exhibit 1: Yield-to-Maturity of the S&P China Bond Indices

20150702

The posts on this blog are opinions, not advice. Please read our Disclaimers.

Inside the S&P 500®: Stocks, Not Indices, Move Markets

Contributor Image
David Blitzer

Former Managing Director and Chairman of the Index Committee

S&P Dow Jones Indices

The S&P 500 is not only the most widely used index for ETFs and funds, it is also the index of choice for researching markets.  Much of the research focuses on the index pop — how much a stock jumps when it joins the index.  About ten years ago some papers on comovement appeared arguing that index membership changes a stock’s behavior and affects the overall market.  The gist of the argument is that two stocks of the similar size, valuation, sector and fundamentals will behave like one-other unless one stock is a member of the S&P 500 and the other is not. The claim is that when a stock joins the S&P 500, its returns comove with the rest of the S&P 500 index but do not fully reflect its fundamentals.  Indices and index membership, not stocks, drive the market.  Moreover, statistical evidence for comovement implied that the expansion of indexing was altering the way stocks behaved such that index membership mattered as much as fundamentals like earnings, dividends and book value; that index membership in the S&P 500 would raise the stock’s β.

Two recent papers dispute this view and show that stocks – and not index membership — are what matters. This new research explains why a stock’s fundamentals appear to shift when it is added to the S&P 500. There is a difference in the behavior of seemingly similar stocks observed when one of the stocks joins the S&P 500.  The difference is seen in changes in the stock’s β and in higher EPS forecasts.  However, this is not the result of some unexplained index membership effect that makes stocks in the index act like one-another or comove. Rather, the changes in a stock joining the index reflect the stock’s own performance in the period before it is added to the S&P 500.

Neither the S&P 500 nor the S&P 500 Index Committee alter the behavior of stocks.  The driving force here is the way the market, on its own, shifts and the process that the Index Committee uses to identify stocks for the S&P 500.  Stocks selected for the S&P 500 should have a market value of $5.3 billion or more and have positive earnings over the last four quarters.  Since there are relatively few stocks outside the index that meet these requirements and since M&A activity continuously generates openings in the index, the place to find good candidates is among profitable growing companies.  These companies often enjoy rising earnings and attract rising analysts’ estimates of future earnings. Moreover, as a stock’s price and market value increases its fundamentals, including its β, will change because it is shifting away from small cap and value towards mid or large cap and growth.  The Index Committee is simply choosing stocks that meet the guidelines so that the S&P 500 continues to reflect the market.

The two recent studies are:

Maria Kasch and Asani Sarkar, “Is There an S&P 500 Index Effect?”, Staff Report No. 484, November 2012, Federal Reserve Bank of New York

Honghui Chen, Vijay Singal and Robert F. Whitelaw, “Comovement Revisited” June 2015, SSRN #2619736.

The often cited paper on comovement is Nicholas Barberis, Andrei Shleifer and Jeffrey Wurgler, “Comovement,”  75 Journal of Financial Economics (2005)

The posts on this blog are opinions, not advice. Please read our Disclaimers.