Get Indexology® Blog updates via email.

In This List

Bonds in a Rising Interest Rate Environment

Fed a Small Step Closer to Raising rates

Though Not In the Lead, After the FOMC Will Leveraged Loans Be The Turtle That Wins the Race?

Muni Minutes – A Changing of the Seasons

Ouch. That’s gonna leave a mark.

Bonds in a Rising Interest Rate Environment

Contributor Image
David Blitzer

Former Managing Director and Chairman of the Index Committee

S&P Dow Jones Indices

After last week’s FOMC meeting, the time when interest rates begin a sustained rise propelled by the Federal Reserve may be drawing closer.  The received wisdom is that no one should own bonds when interest rates are rising because rising rates mean falling bond prices.  While the math demands that bond prices fall, a deeper look at the math reveals that all may not be lost.

Some investors believe that the yield to maturity on a bond measures the return they will earn if they hold the bond until it matures.  Not quite. There is a hidden assumption that the coupon payments received every six months will be reinvested and will earn the same rate as the yield to maturity.  Since interest rates can vary over time and different rates are available for different time frames, this assumption rarely holds.  When interest rates climb after a bond is issued, the price of the bond drops but the returns earned from reinvesting the coupon income benefits from the higher interest rates.  (The reverse also holds, if rates fall after the bond is issued, its price rises but the returns or “interest on interest” from reinvesting the coupons is less.)  If you buy a bond and interest rise far enough and fast enough, you might do better than if rates never moved at all.

A made-up example shows how this might work and how the investor who holds the bond long enough could benefit.  The table shows a theoretical investment in a 2.5% coupon ten year Treasury note bought on January 15, 2015 at a price of 100.  The yield to maturity when purchased is 2.5%.  If rates don’t change and if each semi-annual coupon payment of $1.25 can be invested at 2.5% annual rate for the remaining life of the bond, the investment will be worth $128.20 on January 15, 2025 when the bond matures. The dashed purple line on the graph illustrates this; the right hand scale is the value of the investment in the bond and the coupons.

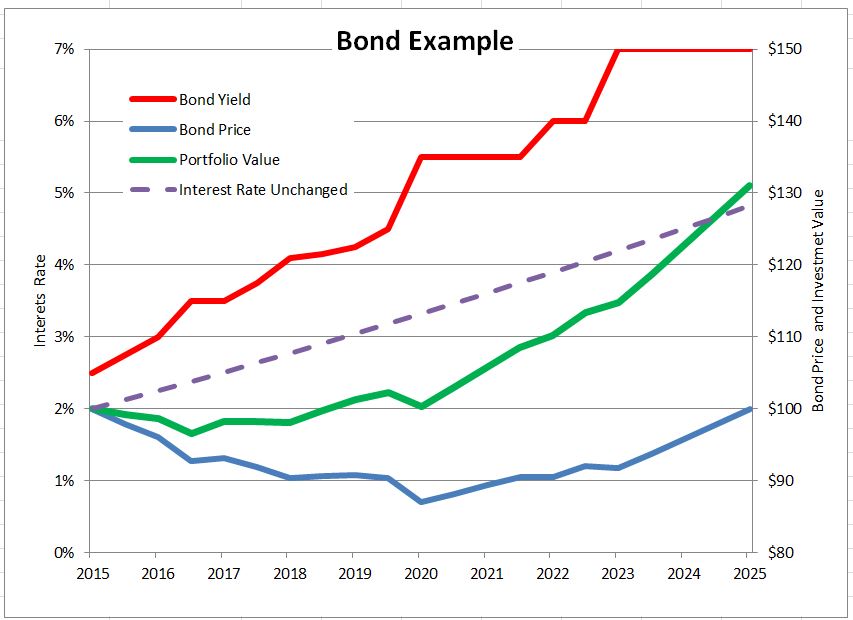
Now let’s change the example shown on the table – interest rates rise and the yield paid on newly issued treasury notes rises towards 7% as shown in the second column of the table.  Further, the coupon income is reinvested in six-month T-bills which pay 1.25% less than treasury notes.   The table works out this example: every six months a coupon payment is received and it is added to the past coupon income and the total is invested at the T-bill rate. These coupon payments – the interest paid on the bond – earn “interest on interest.” At the end of ten years the accumulated coupons total $31.10 ($25 of payments plus $6.10 interests earned on the coupons). The total investment is worth $131.10.  The green line on the chart plots the investment value.  In the early years the rising rates depress the bond price and send the investment into negative territory.  As the accumulated coupon interest increases and as the bond approaches maturity, the investment moves into positive territory and surpasses the theoretical case of no change in interest rates (the dotted line).

bond-1

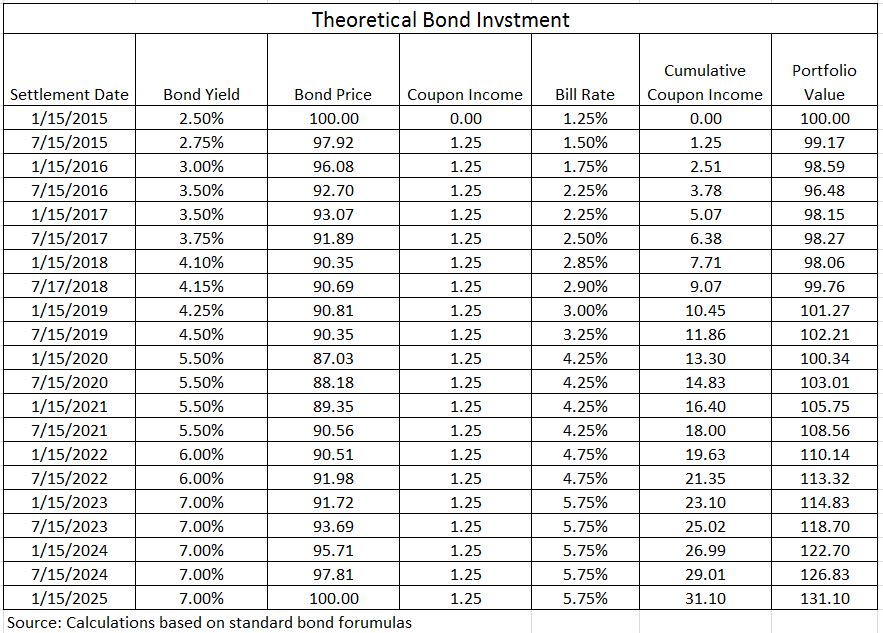
If it is possible to make money with bonds when interest rates rise, why are so many people worried that rates will rise?  The blue line at the bottom of the chart plots the price of the bond for the same time pattern of rising interest rates.  Just as the math requires, rising rates mean lower bond prices.  At maturity approaches the price approaches the par value of the bond – the principal to be repaid at maturity. If an investor didn’t reinvest the coupons, if instead he spent the coupon income, all he would have at maturity is the par value.  Likewise, if   the investor had sold out at the low point on the green line (July 15, 2016) the proceeds for the $100 invested would have been $96.50, a loss of $3.50.

There are no magic formulas for bond investing in any interest rate environment, but working the math sometimes helps.

The posts on this blog are opinions, not advice. Please read our Disclaimers.

Fed a Small Step Closer to Raising rates

Contributor Image
David Blitzer

Former Managing Director and Chairman of the Index Committee

S&P Dow Jones Indices

Fed a Small Step Closer to Raising rates

Today’s FOMC statement published after the meeting is more upbeat than the last one in discussing the labor markets and the inflation outlook.  The FOMC noted “solid gains and a lower unemployment rate” and that the “likelihood of inflation running persistently below 2 percent has diminished somewhat” despite lower oil prices.  In announcing the end of QE, the statement noted “substantial improvements in the outlook for the labor market since” QE began.

The balance in the FOMC may be shifting at the same time. There was one dissent from Narayana Kocherlakota of the Minneapolis Fed arguing for a more dovish position than the Committee took. At the previous meeting in mid-September there were two dissents arguing for a more hawkish position and quicker action for higher interest rates.

The full minutes of the previous FOMC meeting included a discussion of Fed operating procedures and how they would raise interest rates in the face of some $3 trillion-plus of excess reserves. The summary statement from that meeting mentioned concerns about removing policy accommodation.  This time the lack of any mention of operating procedures suggests that the FOMC is confident that it can raise interest rates when the time is right.

None of this points to a precipitous move to boost interest rates quickly. However, the Fed recognizes – and the apparently the FOMC acknowledges to itself – that the policy target on unemployment is close at hand and the trend in core inflation is shifting towards 2%.   Markets and investors will begin to react.  Forecasts of when the Fed might move and what the Fed Funds rate might be at the end of 2015 will be revised to the hawkish side.

The CME Group FedWatch, based on trading in 30 days Fed Funds Futures Contracts, reveals that the probability of a rate hike by next June is above 50-50.   The chart below was captured at 3:50 PM Eastern on October 29th. See the Fed Funds Probability tool here.

The posts on this blog are opinions, not advice. Please read our Disclaimers.

Though Not In the Lead, After the FOMC Will Leveraged Loans Be The Turtle That Wins the Race?

Contributor Image
Kevin Horan

Former Director, Fixed Income Indices

S&P Dow Jones Indices

The senior bank loan or leverage loan market as measured by the S&P/LSTA U.S. Leveraged Loan 100 Index ticked up last week as the index has returned +0.10% month-to-date and 1.56% year-to-date.  Last week’s price action of the secondary loan market assisted the index in clawing back against a month-to-date loss from the beginning of the week of -0.51%.  Much of last week’s leveraged loan positive return accompanied a 3.2% rally in equities (S&P 500) and a 0.8% high-yield bond rally as measured by the S&P U.S. Issued High Yield Corporate Bond Index.  Also aiding in last week’s increase in demand for loans was the fact that new-issue launches have slowed to a trickle.

Currently the 10-year Treasury is yielding 2.25%, 2 basis points lower than Friday’s close of 2.27% for the S&P/BGCantor Current 10 Year U.S. Treasury Index.  If the markets are concerned of news from this week’s FOMC Meeting announcements, they haven’t shown it.  To date the more speculative indices S&P/LSTA U.S. Leveraged Loan 100 Index, S&P U.S. Issued High Yield Corporate Bond Index and S&P Municipal Bond High Yield Index are returning 0.10%, 1.11% and a just slightly negative number of -0.16%, respectively.

Market sentiment can change quickly though and if news from the FOMC does undermine the current risk-on environment; leveraged loans could be the least volatile in price.  Compared to the municipal high yield’s 7.35 year duration and the U.S. Issued High Yield’s duration of 4.86%, the weekly reviewed leverage loan index will be least effected to the change in rates.
Speculative Grade Indice ReturnsSpeculative Grade Return Table

The posts on this blog are opinions, not advice. Please read our Disclaimers.

Muni Minutes – A Changing of the Seasons

Contributor Image
Tyler Cling

Senior Manager, Fixed Income Indices

S&P Dow Jones Indices

Following in suit with the colors of the trees, investor sentiment appears to be cycling. While the market may not be trading high-yield junk for investment-grade positions as quickly as New Yorkers are trading in their flip-flops and shorts for scarves and umbrellas last week, market demand has shifted in October. The S&P/BGCantor U.S. Treasury Bond Index, which tracks over USD 7 trillion of outstanding treasury debt, responded to October’s equity volatility with investors moving toward quality. Wednesday, Oct. 15, 2014, risk adverse demand drove up the price of T-bonds; bringing yields down to the lowest end-of-day close in over a year, at 0.92% (see Exhibit 1). The shift in tide was not lost on the municipal bond market.

Capture

Thus far, 2014 has seen investors clamoring for yields in a low interest and low supply muni market. High-yield munis have outperformed their investment-grade counterparts. Bonds from the Tobacco Master Settlement Agreement of 1998, tracked by the S&P Municipal Bond Tobacco Index have performed outstandingly this year, up 13.36% YTD. However, up to this point of Q3 2014, high-yielding tobacco bonds have remained flat, at 0.03% (see Exhibit 2).

Capture

The S&P Municipal Bond High Yield Index, with a 12.69% return YTD, saw returns go the other way in October, down 0.25% for the month after a mild rebound. A similar trend occurred with the S&P Municipal Yield Index, down 12.04% YTD and down 0.05% MTD, although not as dramatically. The S&P Municipal Yield Index implements a weighted investment strategy based on blended quality (see Exhibit3). The S&P Municipal Bond Investment Grade Index only returned 8.18% YTD, yet saw a jump of 0.61% in October.

Capture

The S&P 500 has recovered from the drop off from the week of Oct. 13, 2014, and the sun came out this weekend, however the market is far from a consensus on what the future will hold. The municipal bond market has many variables to consider, along with a multitude of viewpoints. On November 5, 2014, S&P Dow Jones Indices will be hosting their annual Municipal Bond Forum live online and in New York. Industry leaders from top Wall Street firms will be debating the central issues and solutions facing both the economy and municipal bond market. For more information, please attend our Third Annual Municipal Bond Forum—Rising Rates? How to Deal With “Maybe”.  The event will also be live streamed.

The posts on this blog are opinions, not advice. Please read our Disclaimers.

Ouch. That’s gonna leave a mark.

Contributor Image
Jamie Farmer

Former Chief Commercial Officer

S&P Dow Jones Indices

By my reading, the recent tone in the investment press and blogosphere has been decidedly, shall we say, anti-active.  Index-based investing has won, active has lost, time for stock pickers and portfolios managers to find new careers.  It’s over.

One of the sharper summations of the zeitgeist comes by way of a recent post from The Banker’s Umbrella.  The author takes a sardonic jab at the life of an equity fund manager:  track the index, naively over/under weight a few names, sit back and collect a performance-be-damned paycheck.  Yes, it’s harsh and perhaps the passive-aggressive (sorry, couldn’t help myself) tack warrants a flag for unnecessary roughness.  But underlying the jab are real trends supported by real research.

Perhaps the most succinct example of that research is William F. Sharpe’s “Arithmetic of Active Management,” which says the average active dollar, after costs, must underperform the average passive dollar.  The proof case for Sharpe’s work is S&P Dow Jones’ regularly-published SPIVA researchSPIVA demonstrates that the majority of active managers underperform their benchmarks, especially over longer time periods.  SPIVA’s companion piece, the Persistence Scorecard, shows that it’s nigh impossible for any manager to remain among the top performing segment over time.

Trends can shift and it is possible that the anti-active wave may one day swing back to a more favorable view of professional asset managers.  Regardless of prevailing sentiments, however, there remain sound reasons for the superiority of index investing.

The posts on this blog are opinions, not advice. Please read our Disclaimers.