The S&P Pan Asia Bond Index tracks the performance of the local currency bonds in the 10 Pan Asian countries. The market value tracked by the S&P Pan Asia Bond Index has expanded three fold to USD 6.7 trillion since the index’s first value on Dec. 29, 2006. This rapid expansion warrant some attention as it is compared with the total size of the global debt securities, which is estimated to be over $90 trillion, according to the Bank of International Settlements.^
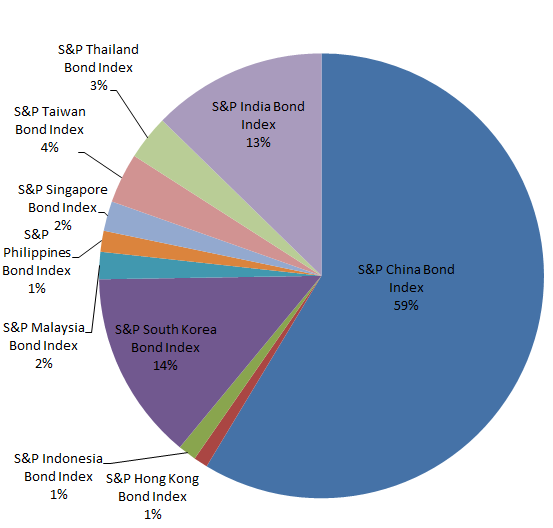
If we look at the market composition of the S&P Pan Asia Bond Index, which is market value- weighted, it is not surprising to see the S&P China Bond Index has a dominant share of 59% with its market value currently stood at CNY 24 trillion. The S&P South Korea Bond Index and the S&P India Bond Index came second and third, respectively. Please see Exhibit 1.
Exhibit 1: Country Breakdown of the S&P Pan Asia Bond Index
In the Pan Asian bond market, while the size of government bonds has doubled to USD 4.8 trillion, the size of corporate bonds jumped 9 times to USD 1.9 trillion in the same period! In fact, the market share of the corporate bond market rose from merely 9% to 28% of the index, which represents a significant reversion from traditionally underdeveloped corporate market, see Exhibit 2.
Exhibit 2: Sector Breakdown of the S&P Pan Asia Bond Index

This growth dynamic is supported by a stronger investor demand, both locally and externally. Many Pan Asian local currency bond markets are now made easier for foreign investors to access, particular through the use of exchange traded products. The regulatory framework also becomes more welcoming, for example, the expansion of Renminbi Qualified Foreign Institutional Investor (“RQFII”) quota in China. Underpinned by the robust economic growth, the Pan Asia bond market has historically been attracting steady inflows.
^Source: http://www.bis.org/statistics/secstats.htm. Data as of December, 2013.
The posts on this blog are opinions, not advice. Please read our Disclaimers.