Get Indexology® Blog updates via email.

In This List

Passively Active: A Passage to India

Irrational Exuberance and Robert Shiller

Coming Soon to a Dictionary Near You

Sentimental Markets

The (Exponential) Power of Interest Rates on Commodities

Passively Active: A Passage to India

Contributor Image
Tim Edwards

Managing Director, Index Investment Strategy

S&P Dow Jones Indices

Globally, over 6 billion U.S. dollars are invested in India Equity ETFs, although less than 200 million via products listed in India.  It’s reasonable to suppose that Indian demand is reflected in the local figures, transferring wealth across Indian borders is both difficult and expensive.  Thus, on the face of it, these figures suggest general indifference to passive investing within the Indian financial community, despite substantial passive interest in India from outside its borders.

The debate between proponents of passive and active investing has been raging for close to a century.  And when it comes to India, the evidence favours the passive investor, much as it does in more-developed markets.  But – in India as much as elsewhere – very few investors are limited to a single asset class.  From the perspective of a multi-asset portfolio, the real picture is much more complicated, and potentially more rewarding.

When looking across asset classes, there is no universally-agreed definition of what ‘the market’ actually is.  In the absence of a widely-accepted bogey, in practice investors frequently build their own: a benchmark comprising a custom blend of markets across a variety of asset types and geographies, representing their overall allocations.  And here’s where it gets interesting.  The impact of changing asset allocation is usually much more significant than changing an individual component benchmark, or changing a component between active or passive allocations.   An investor, manager, advisor or consultant adds the most value when he gets his asset allocation right.  And given the time and effort spent on choosing individual managers, arguably the most efficient way for an investor to spend his time is to focus on actively managing an asset allocation among passively managed components.  In fact, a key driver of ETF growth across the world – ranging from US financial advisors and institutions, European macro-funds and through Asian retail investors – is through such active management via passive asset allocation.  Sometimes old foes can find a new partnership.

These are important considerations for investors in India and elsewhere.  To learn more, please join us for a live 60-minute webinar on December 12, 2013 to hear from practitioners at Kotak Mutual Funds and S&P Dow Jones Indices.  We’ll discuss the trends, opportunities and challenges in investing actively through passive building blocks.

The posts on this blog are opinions, not advice. Please read our Disclaimers.

Irrational Exuberance and Robert Shiller

Contributor Image
David Blitzer

Former Managing Director and Chairman of the Index Committee

S&P Dow Jones Indices

Robert Shiller, Yale economist and author of Irrational Exuberance, who warned of 2000 Tech bust and the housing bubble is warning that equities may be a bubble. Year to date, the S&P 500 is up 26.7% and the Dow Industrials are up 22.4%, both before dividend reinvestment.

The posts on this blog are opinions, not advice. Please read our Disclaimers.

Coming Soon to a Dictionary Near You

Contributor Image
Craig Lazzara

Former Managing Director, Index Investment Strategy

S&P Dow Jones Indices

It may have been 30 years ago, in the early days of stock index futures, that the verb “equitize” (and its cognate noun, “equitization“) came into relatively common use.  The term, if Dr. Johnson will forgive me, meant “to provide equity returns without purchasing equity securities.”  Typically this was accomplished by buying S&P 500 futures — if I had a $10 million cash position, I could “equitize” it  by buying S&P 500 futures with a notional value of $10 million.  Unless I’d made a severe arithmetic error, the total return of my cash + futures position would very closely approximate that of a $10 million S&P 500 index fund; hence my cash had been equitized.

For unknown reasons, “bonditize” or “bondize” never caught on.

I propose that indicize (and its noun form, indicization) will sooner or later find their way into common use.  To offer an inelegant definition, indicize means to provide, in passive form, a strategy formerly available only via active management.  Consider, e.g., a hypothetical investor who wants to tilt her portfolio toward small-cap growth stocks.  Thirty years ago, her only option was to buy a mutual fund whose manager avowed a specialization in small-cap growth, and then to hope for three things:

  1. That the manager shared the investor’s definition of small-cap growth
  2. That the manager didn’t change his mind (for instance, by deciding that large-cap value offerered better opportunities this quarter) during the investor’s holding period
  3. Most importantly, that the manager’s stock selection ability, if not positive, was at least not so negative that it overcame the putative benefits of being in small-cap growth in the first place.

Since then, of course, advances in passive management mean that a strategy like small-cap growth is easy to indicize.  (Today our hypothethical investor’s main problem would be to decide which of several ETFs or mutual funds specializing in small-cap growth she’d prefer to buy.)  There’s no need to expose herself to the vagaries of active management when a passive solution can provide efficient and inexpensive exposure to the factors about which she really cares.  And of course indicization isn’t limited to size and style portfolios, but extends to other themes — low volatility comes immediately to mind — as well.

This makes the active manager’s life harder.  In former days, he could expect to be paid both for providing access to factor exposures as well as for stock selection; today, he’s increasingly limited to stock selection as factor exposure is indicized.  For the same reason, indicization is an unambiguous benefit for the investor.


The posts on this blog are opinions, not advice. Please read our Disclaimers.

Sentimental Markets

Contributor Image
David Blitzer

Former Managing Director and Chairman of the Index Committee

S&P Dow Jones Indices

The Fed’s QE policy is credited with, or blamed for, inflating prices of homes and stocks. The forces pushing prices up in these markets may be the same, but buyers’ perspectives are very different.  When the S&P/Case-Shiller home price numbers were released yesterday (November 26th) there were fears that bubbles were back, especially in San Francisco and two notorious housing markets: Phoenix and Las Vegas.  `The stock market story is different.  It has risen farther, faster and for longer than homes.  For each commentator or forecaster who evidences nervousness, there are three, four or more ex-bears abandoning fear and buying stocks.  Everyone says the market can’t go up forever, but they also expect it to keep rising.  There is a minority worried about bubbles or crashes and an even smaller minority selling stocks or buying puts.

The S&P/Case-Shiller indices show that monthly price gains have been shrinking since April.  As home prices rise, some would-be buyers are priced out of the market or into smaller homes.  Further, rising prices attract new sellers, increasing supply and leading to smaller price gains, or even declines.  This is the way most markets work.  Current market sentiment and supply-inducing price increase make bubbles in house prices unlikely. Stocks are different: rising prices of either specific stocks or indices attract more buyers. The different reactions in house and stocks affect the market sentiments; and the sentiments drive the markets.

Why aren’t more people worried about the stock market?  The most common answer is fundamentals.  Earnings are rising, the PE ratio is close to its long term average, and we’ve reached these levels before without a collapse.  Looking back to the period since the market bottom in March, 2009, earnings and stock prices have risen almost in tandem. Both the PE ratio and the price-to-book ratio on the S&P 500 are only modestly higher than when the current bull market began.  However, some members of that minority of worriers are looking farther back.  Corporate earnings as a percentage GDP are at record levels. Moreover, the ratio of corporate earnings to GDP tends to mean revert – when it gets too far out of line, it heads back towards its average.  Sustaining strong earnings growth will require strong GDP growth, something we haven’t had much of lately. Maybe the Fed’s QE will work its magic on GDP growth.

The posts on this blog are opinions, not advice. Please read our Disclaimers.

The (Exponential) Power of Interest Rates on Commodities

Contributor Image
Jodie Gunzberg

Former Managing Director, Head of U.S. Equities

S&P Dow Jones Indices

Literally – or at least mathematically – there are two equations that tell the tale of interest rate impacts on commodities.

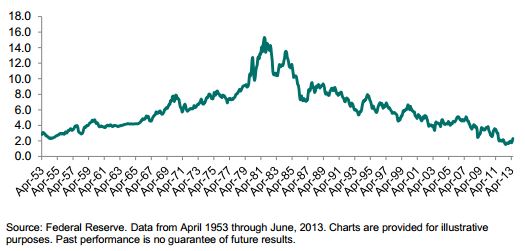
As my colleagues Fei Mei Chan and Craig Lazzara pointed out in a recent paper they authored, Much Ado About Interest Rates, “Since yields peaked in 1981, the three subsequent decades have witnessed a remarkable bull market for bonds. The yield of the 10-year Treasury bond fell from more than 15% in 1981 to its current level of less than 3%. With interest rates at historically low levels, investors might reasonably assume that it’s not a matter of if but a question of when rates will increase.

10-Year Treasury Yield from 1953-2013 Interest Rates

I’m not in the position to answer the question of when interest rates will rise but can explain how rising interest rates factor into the equations of commodity pricing and index returns.

The most direct and measurable impact of interest rates on commodities can be observed from the formal relationship between spot and futures prices, as defined by the theory of storage equation which can be written as:

F0,T = S0 exp[(r+c-y)T]

Where:

F0,T= the futures price today for delivery at time T;
S0 = the spot price today;
r = the riskless interest rate, expressed in continuous time;
c = the cost of physical storage per unit time, expressed in continuous time;
y = the convenience yield, expressed in continuous time.

This equation is often used to explain the futures price in terms of the spot price, the interest rate, the cost of storage and the convenience yield as discussed by Gunzberg and Kaplan (2007).

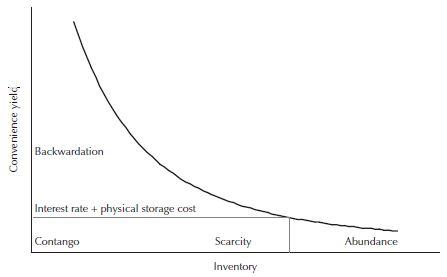
Although the interest rate and cost of storage are straightforward, the convenience yield is more complex.  It’s defined by the flow of benefits to inventory holders from a marginal unit of inventory. Generally, inventory levels have an inverse relationship with convenience yield.  This means that there is a low convenience yield when inventories are high.  However, as inventory levels fall, the convenience yield increases at an accelerated pace as inventories are depleted.

The Demand For Storage

Source: “The Long and Short of Commodity Index Investing”, by Jodie Gunzberg and Paul Kaplan, Intelligent Commodity Investing, edited by Hilary Till and Joe Eagleeye 2007.
Source: “The Long and Short of Commodity Index Investing”, by J. Gunzberg and P. Kaplan, Intelligent Commodity Investing, edited by H. Till and J. Eagleeye 2007.

Simply put, there is a price consumers are willing to pay to have immediate access to a commodity during a shortage. As an example, a refiner is likely to pay a premium to have oil when there is a shortage so that its production of gas is not disrupted.

Storage can be used by both producers and consumers to fill gaps between production and sales, or between purchases and consumption.  When a commodity is placed in storage to be delivered at a set time in the future at the futures price, then the opportunity to earn interest from selling the commodity in the spot market, then investing in a t-bill is lost. Also, one will pay the cost of the storage facility plus will gain (or lose) from the difference between the spot price and futures price.

Based on the above theory, two probable implications can be drawn about the effect of rising interest rates on commodities:

  1. Futures prices rise, and
  2. By storing, the opportunity cost is higher from the forgone interest so the incentive to store diminishes.  Not only does the incentive to store diminish, but the rising rates may motivate investors to shift investments from commodities to yield-generating capital assets.  

The second equation that demonstrates the direct impact of interest rates on commodity index returns is the total return (TR) calculation:

S&P GSCI TRd = S&P GSCI TRd-1* (1 + CDRd + TBRd)* (1 + TBRd)days

Where:

S&P GSCI TRd = the value of the S&P GSCI TR on any S&P GSCI Business Day, d

CDRd = the Contract Daily Return value represented as the percentage change in the Total Dollar Weight of the S&P GSCI on any S&P GSCI Business Day, d

TBRd= the Treasury Bill Return on any S&P GSCI Business Day, d =[1/(1-91/360*TBARd-1)1/91-1, where TBARd-1 = the 91-day discount rate for U.S. Treasury Bills, as reported by the U.S. Department of the Treasury’s Treasury Direct on the most recent of the weekly auction dates prior to such S&P GSCI Business Day, d.

days = the number of non S&P GSCI Business Days since the preceding S&P GSCI Business Day.

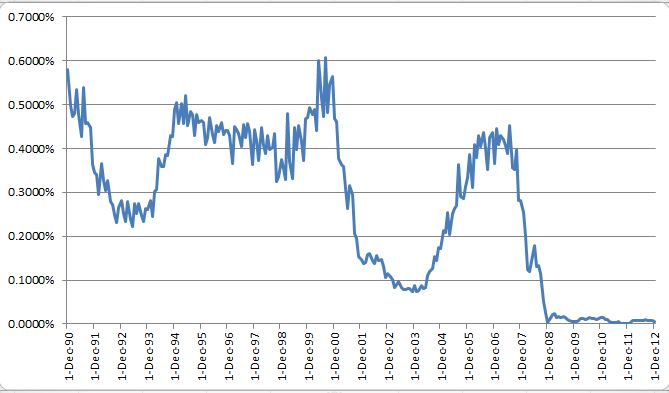
By definition, total return versions of commodity indices, such as the DJ-UBS CI and the S&P GSCI®, that incorporate the returns of the excess return (ER ) plus the Treasury Bill Return are positively impacted by rising interest rates which earn interest on the collateral of the futures contracts. Below is a chart showing the monthly return difference between the S&P GSCI TR and S&P GSCI ER:

S&P GSCI Total Return – S&P GSCI Excess Return

Source: S&P Dow Jones Indices. Data from Dec 1990 to Dec 2012. Past performance is not an indication of future results. This chart reflects hypothetical historical performance. Please see the Performance Disclosure at the end of this document for more information regarding the inherent limitations associated with backtested performance

Source: S&P Dow Jones Indices. Data from Dec 1990 to Dec 2012. Past performance is not an indication of future results. This chart reflects hypothetical historical performance. Please see the Performance Disclosure at the end of this document for more information regarding the inherent limitations associated with backtested performance

Since these indices are fully collateralized, this means that no leverage is used to gain exposure to the commodities through futures.  As such, for every dollar of exposure, there is 100% cash in margin earning interest.  The benefits are: the expected inflation plus real rate of return as well as an increase in the total return, by definition, as interest rates rise.

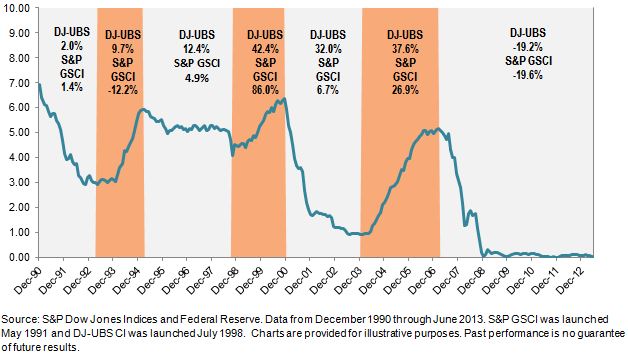
In isolation the relationship between interest rates and commodities is clear from the math. However in reality, there are other simultaneous factors so the results have been less obvious but there is potential for high commodity index returns in rising rate environments.

Commodity Index Performance during Periods of Rising and Falling Interest Rates

(Notice the similarity between the interest rates plotted below and the S&P GSCI TR- S&P GSCI ER in the graph above.)

Rates Commodities Returns

Last, I would like to mention my colleagues and I are each contributing articles on impacts of rising interest rates on various asset classes in the next edition of the S&P Dow Jones Indices’ quarterly magazine called Insights, so be sure to check it out.  

The posts on this blog are opinions, not advice. Please read our Disclaimers.