Get Indexology® Blog updates via email.

In This List

What Me Worry

The Shrinking Supply of Alpha

High Yield Munis Burned by Tobacco Bonds

Welcome Janet Yellen

The Tactical Case for Bond Ladder ETFs

What Me Worry

Contributor Image
David Blitzer

Former Managing Director and Chairman of the Index Committee

S&P Dow Jones Indices

While the stock market was up sharply on Thursday and rose a bit more on Friday amidst rumors of some talks in Washington,  not everyone thinks we’re  out of the woods.  In fact, other parts of the financial system are taking precautions in case the worst – a government default – happens.  Hopefully both these trends will continue:  some large market moves combined with disaster preparation might convince Washington that Wall Street really does want all this nonsense settled, the debt ceiling raised, the government re-opened and (maybe) Congress to get back to work.  The market moves this past week were a start but not big enough to carry a lot of conviction. Moreover, a big drop in response to stubbornly little progress early in the week might have scared Congress into some activity.

The disaster planning is mostly about Repos – short term collateralized loans.  The most common collateral since the financial crisis has been short term treasury securities.   In normal times, the credit quality of treasuries is as close to impeccable as anything. These are not normal times.  Discussions about re-writing the legal agreements behind repos are going on, some money market funds are selling treasuries for fear of a default and Senator Sherrod Brown, a Democrat on the Senate Banking Committee asked two major banks which arrange some $2 trillion of repos what would happen in a default.  In Hong Kong, the exchange is asking for additional collateral in some transactions.

Understanding and planning for investment risks is never easy.  The hardest risks to plan for are those with a very small chance of occurring, but if they happen the damage would be immense.  Outside of finance these might be things like nuclear power plant meltdowns or 100-year storms.  Yes, such things do happen: ask Japan about Fukushima or recall “Super Storm Sandy” in New York City about a year ago.  A default by the US treasury – the key underpinning and support for the world’s financial system  — would be a low probability event causing immense damage.

The posts on this blog are opinions, not advice. Please read our Disclaimers.

The Shrinking Supply of Alpha

Contributor Image
Craig Lazzara

Former Managing Director, Index Investment Strategy

S&P Dow Jones Indices

Recently we attended a conference at which many hedge fund representatives were present. Not surprisingly, there was much discussion of the ability of hedge funds, and by extension active managers generally, to generate alpha. This raises an obvious question: what is the market’s capacity to produce alpha?  Is there a natural limit to investors’ ability to earn excess returns?

One way to frame this issue is to ask a related question: how much beta is there? This turns out to be a fairly easy computation. As of September 30, 2013, the total value of the U.S. stock market was $18.8 trillion. So in aggregate, there’s $18.8 trillion of U.S. beta available.

If the market’s “beta capacity” is $18.8 trillion, what is the market’s “alpha capacity?” The answer, in aggregate, is $0. There is no natural source of alpha. I can earn a positive alpha only if some other investor earns a negative alpha. Successful (or lucky) active equity managers, in aggregate, can only produce positive alpha if less successful (or unlucky) managers endure negative alpha. And of course trying to earn alpha costs more than passive management, whether the quest is successful or not. So it’s not surprising that a majority of active equity managers typically underperforms a passive benchmark, nor is it surprising that passive management has consistently gained market share relative to active management.

All of which is relevant to our initial question about the aggregate supply of alpha. Consider two scenarios. First, assume that the $18.8 trillion U.S. equity market is entirely actively managed.  Then $9.4 trillion is controlled by below-average managers, and $9.4 trillion is controlled by above-average managers.  Assume that the average below-average manager underperforms by 2% per year.  Then the total alpha available for the above-average managers to harvest is $188 billion (2% of $9.4 trillion).

Now assume that 10% of the market is controlled by index funds, leaving $16.92 trillion for active managers. Half of this value will underperform. Let’s assume that the average below-average manager now underperforms by 1.5% per year (which is consistent with the assumption that the worst active managers are index funds’ first victim). Then the aggregate alpha available to the above-average managers is $126.9 billion (1.5% of half of $16.92 trillion). The aggregate alpha pool has fallen by more than 30%.

By reducing the number of potentially-underperforming active managers, indexing reduces the rewards for those that remain.

The posts on this blog are opinions, not advice. Please read our Disclaimers.

High Yield Munis Burned by Tobacco Bonds

Contributor Image
J.R. Rieger

Former Head of Fixed Income Indices

S&P Dow Jones Indices

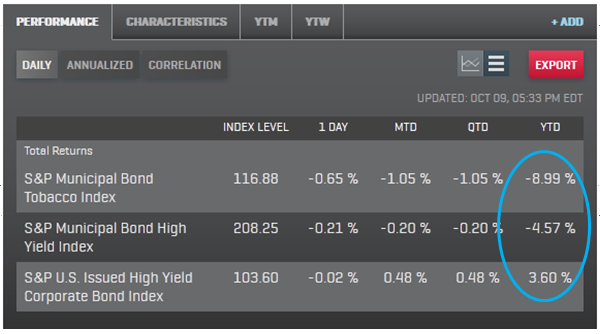
Tobacco settlement  bonds tracked by the S&P Municipal Bond Tobacco Index are down nearly 9% year to date as yields have risen by over 255bps as the credit risk of these long duration bonds is questioned.  Recent arbitration results have been positive but uncertainty over future disputes and tobacco consumption are pulling these long duration bonds down.  The average duration of the S&P Municipal Bond Tobacco Index is over 11.5 years.

The S&P Municipal Bond Index, which includes tobacco settlement bond issues that are  below investment grade, is down over 4.5% year to date with yields rising by over 150bps.  The tobacco bond exposure helps lengthen the duration of the index to over 9 years.

By comparison, the S&P U.S. Issued High Yield Corporate Bond Index has a duration of over 4.8 years and is up 3.6% year to date.

Source: S&P Dow Jones Indices LLC and/or its affiliates. Data as of October 9, 2013. Charts and graphs are provided for illustrative purposes. Past performance is no guarantee of future results.

To learn more on the municipal bond market, join us for an event in New York next Thursday, “Where are Municipal Bonds Creating Opportunities for You?” Keynote speaker, Jim Lebenthal, co-founder of Lebenthal Asset Management, will examine the overall health of the market and explore current opportunities in U.S. infrastructure and municipal bonds.  Click here to register and for more details.

The posts on this blog are opinions, not advice. Please read our Disclaimers.

Welcome Janet Yellen

Contributor Image
David Blitzer

Former Managing Director and Chairman of the Index Committee

S&P Dow Jones Indices

Today’s nomination by President Obama of Janet Yellen as the next chairman of the Federal Reserve is very welcome.  Yellen’s knowledge of the Fed, the banking system and the economy is second to none.  No one, except possibly Ben Bernanke, has more experience on the job.

While Janet Yellen’s nomination is very likely to be approved by the Senate, there will be some sharp questioning during the hearings before the Senate Banking Committee.  Just as the Fed Board itself has differing opinions about the economy and the proper timing for winding down QE3, a number of Senators also have ideas.  Moreover, since Yellen has been Vice-Chair since 2010 and worked closely with Bernanke, she will be asked to explain and defend some of his actions.  There are elements of current Fed policy other than QE3 which should be discussed:  should the Fed continue to open up and increase its visibility and transparency, should it make more use of future commitments and forecasts in implementing monetary policy and can it manage investors’ expectations. These go more deeply into how the central bank should operate and will give the Banking Committee more insight into Janet Yellen’s approach to central banking.  Beyond Fed policy, questions could touch on “too big to fail” banks, bank capital ratios or what Dodd Frank looks like in 2013 and 2014.

One issue we’re likely to hear too much about is printing too much money, setting the stage for inflation and debauching the currency.   Printing too much money is an old argument that may never have contained much truth and which certainly doesn’t apply now.  Those who fear that the Fed’s recent policies of buying government securities and expanding its balance sheet will cause massive inflation need to explain why the inflation isn’t here. Quantitative easing is no longer new and inflation is, if anything, too low.

The posts on this blog are opinions, not advice. Please read our Disclaimers.

The Tactical Case for Bond Ladder ETFs

Contributor Image
Matthew Forester

Chief Investment Officer

CFG Asset Management

Bond Ladder ETFs are providing a unique solution for managing duration risk. These ETFs, now available for the municipal, corporate and high yield sectors, enable more precise control over duration risk than previous fixed income ETF offerings. Moreover, they have performance benefits relative to traditional fixed income index funds and ETFs if the rising rate and steep slope yield curve environment persists.

In addition to delaying the onset of tapering, the September FOMC (Federal Open Market Committee) meeting and communications have clarified the timing of any future hikes of the Federal Funds rate. The message is clear – we should remain at nearly zero for an extended period of time, perhaps years.

Absent any potential data-dependent alterations, the short end of the taxable yield curve should remain anchored.  Therefore, most bond market yield curves should remain steeply sloped. Returns to taking on additional duration risk should remain elevated. But, as we’ve learned since last July (and in 1994 and 2004), long rates accelerating higher can prove immensely damaging to principal. Taking on additional duration risk from holding longer maturity debt can be risky.

This environment emphasizes that investors need to make suitable and precise choices for duration risk.  Unfortunately, most bond market index funds and ETFs attempt to match duration to a bond index.  In a rising interest rate environment, these funds have to continually add duration (longer bonds) in order to match their benchmark duration and replace expiring or called shorter issues. Unfortunately, the bonds they add to the index are also the bonds where the duration risk is concentrated. These funds cannot “roll down the curve”, or capture the duration risk premium as average maturities decline with time.

Several ETF sponsor firms offer a new class of fixed income fund that only invests in selected maturities.  In these bond ladder ETFs, all of the underlying investments are concentrated in a selected maturity window (e.g., 2018 investment grade corporates or 2017 municipals). This new type of bond fund offers the ability to tailor duration risk and sector exposure to match risk and return objectives.

Since bond ladder ETFs are designed to mature, you can stack them together in an arrangement that resembles a traditional, but more diversified, bond ladder (hence the term Bond Ladder ETFs).  By stacking the ETFs, you own multiple highly-diversified baskets of underlying bonds. Just like equity ETFs, one of the prime advantages of fixed income ETFs is diversification. Since the ETFs trade like equities, an investor (particularly smaller advisors, institutions and firms) do not need to deal with the headaches of individual bond trading. Trading odd lots is a treacherous and frequently unprofitable undertaking for most smaller investors.

In this steep yield curve environment, the Bond Ladder ETF structure offers a unique solution to adding diversification to the traditional bond ladder. Having precise control over sector exposure and duration risk could prove rewarding if the current fixed income dynamic looks likely to persist.

S&P Dow Jones Indices is an independent third party provider of investable indices.  We do not sponsor, endorse, sell or promote any investment fund or other vehicle that is offered by third parties. The views and opinions of any third party contributor are his/her own and may not necessarily represent the views or opinions of S&P Dow Jones Indices or any of its affiliates.

The posts on this blog are opinions, not advice. Please read our Disclaimers.