Get Indexology® Blog updates via email.

In This List

US Energy Production & Its Growth Dividend

The Shutdown and The Debt Ceiling

Commodities Crystal Ball: What do the FUTURES hold?

Active vs Passive Investing – Looking at 2013 Mid-Year Results

Who's Calculating Your Index?

US Energy Production & Its Growth Dividend

Contributor Image
Bluford Putnam

Managing Director and Chief Economist

CME Group

The substantial increase in the supply of energy from the United States is providing the US with an economic growth dividend. Since 2005, which we use as our base year since it roughly represents the year before the energy revolution in the US started, crude oil production in the US has increased 29% and natural gas production has grown 33%. The numbers are impressive and they continue to grow.

Quantifying the US energy boom’s contribution to economic growth is not easy, even though it is obviously substantial.  As is the often the case with economic impacts, the indirect effects can be much larger and more powerful over time than the direct effects.  This makes quantifying the growth benefits to the US economy of the energy supply boom more of an art than a science.

In the US, we are seeing new infrastructure being built to move oil and gas production to users.  Shifting relative prices have encouraged substitution of one form of energy for another and have stimulated construction, including new industrial plants near the sources of the new supplies, especially natural gas.  In some cases natural gas has replaced coal as fuel for generating electricity, and the displaced coal has served to increased US exports.  Natural gas has not generally been considered a transportation fuel, yet its abundance and lower price per BTU is generating greater interest to power bus fleets as well as train locomotives.

Taking a very broad view of the indirect stimulus coming from the new oil and natural gas production, the incremental advantage to the US is probably between 0.5% and 1% of extra real GDP per year, and this energy growth dividend may last for the next five years or more as production continues to increase, as the distribution infrastructure is built, and as industrial users make new investments and build new plants to take advantage of the energy boom.

As noted, our energy growth dividend assessment is more of a back of the envelope calculation than a detailed quantification.  Some energy analysts would go with a higher impact, while some traditional macroeconomists are on the lower side.  No one, however, is downplaying the long-term importance to the US economy.  What is clear is that the energy boom has come at a very good time for the US economy relative to other industrial economies struggling with the lingering aftereffects of the Great Recession of 2008-2009.

 All examples in this report are hypothetical interpretations of situations and are used for explanation purposes only. The views in this report reflect solely those of the authors and not necessarily those of CME Group or its affiliated institutions. This report and the information herein should not be considered investment advice or the results of actual market experience.

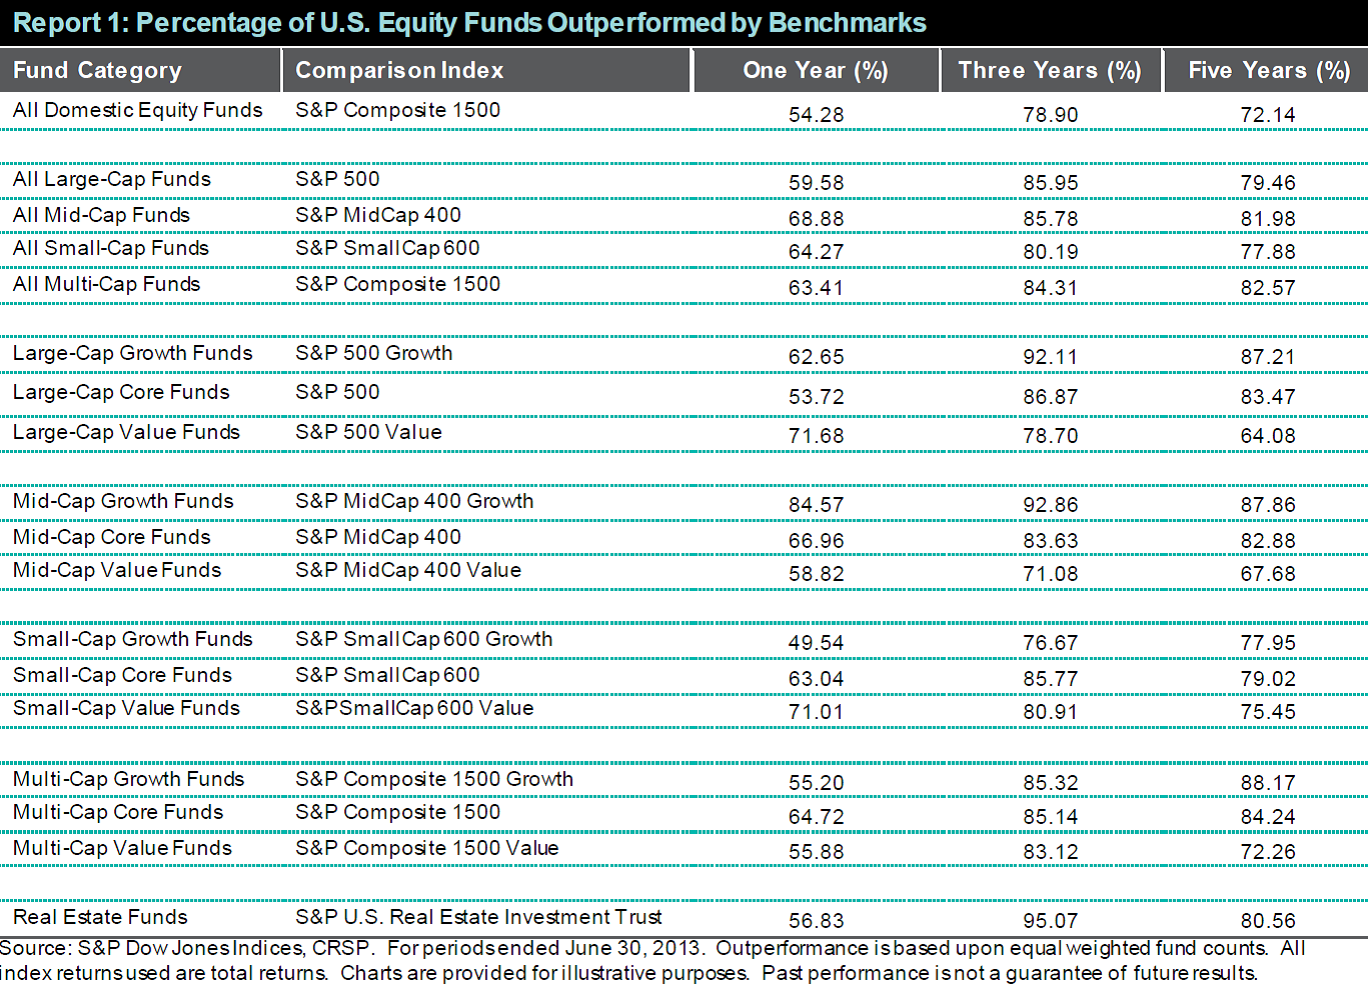
S&P Dow Jones Indices is an independent third party provider of investable indices.  We do not sponsor, endorse, sell or promote any investment fund or other vehicle that is offered by third parties. The views and opinions of any third party contributor are his/her own and may not necessarily represent the views or opinions of S&P Dow Jones Indices or any of its affiliates.

The posts on this blog are opinions, not advice. Please read our Disclaimers.

The Shutdown and The Debt Ceiling

Contributor Image
David Blitzer

Former Managing Director and Chairman of the Index Committee

S&P Dow Jones Indices

As of the market close on Monday, Congress is still pushing bills back and forth from one house to the other and a government shutdown looks like the odds-on bet.  The S&P 500 rebounded part way from a sharp drop at the open but has done little since mid-morning.  If the Credit Default Swap market is any indication, the shutdown could be followed by a debt ceiling impasse.   The markets are saying the shutdowns matter and the debt ceiling matters even more.

Shutting the government down for a few days will cost. In 1996 the bill was about $100 million per day due to delays, disruptions and time spent recovering from the shutdown.  The larger damage is probably to how we feel our government and how it looks to others.  Analysts and commentators criticize some European nations which can’t seem to pass a budget, collect taxes or keep a government in office for more than a few months.  If the US begins to look and act that way, can we expect investors – either foreign or domestic – to have confidence in our markets?  The cost of a government shutdown is not $100 million a day or delaying next Friday’s employment report, it is the loss of confidence.

The debt ceiling is another matter.  The damage would be severe as explained in comments today from the New York Times and the Financial Times.  If the debt ceiling isn’t raised the President will face a three-way choice: slash an estimated $600 billion from spending immediately, default on maturing US treasury bills, notes and bonds or ignore the debt ceiling.  Slashing that much spending would mean the government really shuts down – no social security payments, no salaries, no contracts with payment due, nothing at all.  Defaulting on the debt would be worse.  In 2008 when Lehman Brothers went bankrupt, the financial system froze because no one would trust the collateral behind Repos. (Repos, repurchase agreements, are the ways banks, brokers, corporations and money market funds invest overnight.) Without Repos,  there is no access to large amounts of short term overnight credit.  If there is a default, repos with treasury collateral won’t be accepted.   If all the other options are terrible, the one that’s left is to ignore the debt ceiling.  No matter which choice the President makes, the markets are likely to react badly.

The posts on this blog are opinions, not advice. Please read our Disclaimers.

Commodities Crystal Ball: What do the FUTURES hold?

Contributor Image
Jodie Gunzberg

Former Managing Director, Head of U.S. Equities

S&P Dow Jones Indices

What strategies will be the most profitable over the next 12 months?  Which spread will have the greatest opportunity? These are just a few questions we asked the audience at our S&P Dow Jones Indices 7th Annual Commodities Seminar, and we thought you may be interested in their answers.

As I mentioned in a recent CNBC interview, the three main factors influencing commodities currently are quantitative easing, Chinese demand growth and geopolitical tensions.  This backdrop has been characterized by more frequent backwardation and lower correlations.

Commodity Correlations

Given the more frequent backwardation in 2012 and 2013, the performance of more flexible strategies like the S&P GSCI Roll Weight Select and S&P GSCI Dynamic Roll have outperformed their static counterparts. See the table below:

Source: S&P Dow Jones Indices. Data from Dec 2011 to Aug 2013. Past performance is not an indication of future results. This chart reflects hypothetical historical performance. Please see the Performance Disclosure at the end of this document for more information regarding the inherent limitations associated with backtested performance

Also, below are two research papers on the fundamentals of why this is the case:

Research by Barclays shows investors are taking notice and assets are flowing into more active strategies.

AUM Barclays Commodities

Will this continue? We asked our audience, Which index strategy do you believe will be most profitable over the next 12 months?”

Below are their answers, which match the trend of flows into active indexing but buck the trend that flows of  fixed are declining compared to standard. 

13.0%  Front month
26.1%  3-Month Forward
30.4%  Dynamic Roll
30.4%  Long-Short Trend Following

Another question we asked was regarding in which spread is the greatest opportunity?

See the answers from the audience in the charts below:

Source: S&P Dow Jones Indices. Data from Feb 1999 to Aug 2013. Past performance is not an indication of future results. This chart reflects hypothetical historical performance. Please see the Performance Disclosure at the end of this document for more information regarding the inherent limitations associated with backtested performance

What are your predictions? We’d love to hear!

The posts on this blog are opinions, not advice. Please read our Disclaimers.

Active vs Passive Investing – Looking at 2013 Mid-Year Results

Contributor Image
Aye Soe

Former Managing Director, Global Head of Core and Multi-Asset Product Management

S&P Dow Jones Indices

The past 12 months ending June 30 saw an impressive rally in the domestic equity markets with S&P 500, S&P MidCap 400 and S&P SmallCap 600 posting double digit gains.  During that period, the majority of active managers in all the categories except small cap growth underperformed their benchmarks.  The SPIVA 2013 mid-year report shows that over the past twelve months, 59.58% of large-cap funds, 68.88% of mid-cap funds and 64.27% of small-cap funds underperformed their respective benchmark indices. The figures are even more underwhelming when viewed over the three- and five- year horizons.  The majority of the active managers in all the domestic equity categories underperformed their respective benchmarks.

The report also highlights another investing myth.  Active investing is thought to be a better way to access less efficient markets such as small cap equity than passive investing.  However, as the SPIVA Scorecard shows, 77.88% of actively managed small cap funds underperform the S&P SmallCap 600 over the past five years.  If we go back further, say to the end of 2006, we can see that nothing much has changed.  Over the five year period ending December 31, 2006, 76.47% of small cap managers underperformed the benchmark.  This, of course, poses an interesting question of how much of the Efficient Market Hypothesis has been wrongly used to propel the myth of active investing for small cap equity.

indexology

The posts on this blog are opinions, not advice. Please read our Disclaimers.

Who's Calculating Your Index?

Contributor Image
Michael Mell

Global Head of Custom Indices

S&P Dow Jones Indices

Most investors assume that ETFs are passive investment tools tracking independently calculated indices, that premise has arguably been one of the key factors driving the popularity of ETFs.  In the past investors and advisors could be confident about their understanding of an ETF by reviewing the rules governing the underlying index.  To a large extent this made ETFs the diametric opposite of most mutual funds (which are actively managed) because with ETFs you knew what you were getting via the index.  Previously even self-indexed ETFs were required by the SEC to track independently calculated, rules based indices that publically disclosed their methodology and underlying constituents. This is no longer the case.

An entire crop of self-indexed “passive” ETFs are being launched where index transparency has been removed and instead only the holdings of the ETF need to be disclosed.  Arguably these types of ETFs are no longer a reliable alternative to mutual funds and other active investment products.  Alarmingly since these new “ETFs” are technically index based, they will probably enjoy a false association to ETFs that track independently calculated indices.

The philosophy behind passive index investing helped make the ETF into a trusted vehicle.  To maintain that trust it will be more important than ever for investors and their advisors to demand ETFs tracking independently calculated rules based indices.

Caveat emptor.

The posts on this blog are opinions, not advice. Please read our Disclaimers.