Get Indexology® Blog updates via email.

In This List

Dividends: Love'm or Leave'm

Who Dun it?

A Conventional Down Month

Only a Few Hours Left, but June’s Returns Have Not Been Seen Since 2008

Remembering the Great Bond Rally

Dividends: Love'm or Leave'm

Contributor Image
Howard Silverblatt

Senior Index Analyst, Product Management

S&P Dow Jones Indices

Now that the short-term speculators have left the dividend market, core investors can get back to their boring stocks, collecting their tax advantaged yield (you may not like the increase to 20% from 15%, but I remember when it was 70%, and that was before New York State, City or unincorporated business tax got hold of you – talk about a minority interest).  The linked dividend report below is on U.S. domestic common stock for Q2 2013, and shows another good quarter.  My takeaway for the S&P 500 is below:

I expect dividend growth in the second half for the S&P 500 to be less than the first half due to the large December 2012 payout which was inspired by tax concerns.

The numbers works out to an upper-single digit second half increase, putting the 2013 dividend payment gain into double-digit territory.

The expected 2013 payment would set a new record over the current 2012 record – a year which included significant accelerated payments from 2013.

2013 would be the third double-digit gain in a row; the record is 4, set in 2004-7 and 1947-50.

2014, as the Fed would say, is data dependent (economy).

http://yhoo.it/120LeYu

The posts on this blog are opinions, not advice. Please read our Disclaimers.

Who Dun it?

Contributor Image
David Blitzer

Former Managing Director and Chairman of the Index Committee

S&P Dow Jones Indices

Beginning in May and then aggressively following Fed Chairman Ben Bernanke’s June 19th press conference interest rates rose.  The yield on the 10 year treasury both led the way and spooked the markets world-wide.  Analysts raised the specter of an early end to QE3, cited Bernanke’s comments and hinted that the central bank was about to abandon the markets. Stocks responded with a sharp slide. Just as it seemed that all were united in castigating the Fed for bringing on the inevitable end to bond bull market, a counter attack was launched.

In the week and a half since the press conference, the Fed has put on a full court press with speeches from two Fed Governors and timely news stories pitching the idea that the rate rise was a case of premature market jitters. Why did rates rise? Some of the comments in Bernanke’s press conference reminded everyone that sooner or later QE3 would end and that, if the Fed’s economic forecast proved reasonably correct there would be no QE4.  While no one wanted to be reminded that QE3 would end; there were other factors in the press conference and the market.  Bernanke talked about beginning to taper off QE3 if the unemployment rate slipped into the neighborhood of 7%.  Some may have confused this with comments from a few months ago that the Fed Funds target would remain zero to 25 bp until the unemployment rate reached 6.5% . (It is 7.6%, at least until the next report on Friday morning). The Fed has two unemployment rate targets – one for QE3 and another for the Fed Funds rate.

More important than the double unemployment rate targets, the Fed confirmed both in the press conference and in those recent speeches that monetary policy will respond to the economy and that it believes the economy is beginning to improve.  The Fed’s own forecast for 2014 looks almost rosy at 3% to 3.5% real growth, at or above trend.  That growth, rather than monetary policy, will boost interest rates.

Who dun it? The number one suspect is the economy. As to the central bank, one might consider it an accessory before the fact – and offer a compliment for their success.

The posts on this blog are opinions, not advice. Please read our Disclaimers.

A Conventional Down Month

Contributor Image
Craig Lazzara

Former Managing Director, Index Investment Strategy

S&P Dow Jones Indices

Whenever you want to argue that rising interest rates are bad for the stock market, count June 2013 as a point in your favor.  The long end of the US Treasury yield curve notched a -4.07% decline in June (following May’s -6.71% tumble), as rates on the S&P/BGCantor 20+ Year US Treasury Index rose by 66 basis points from their April low.  Equities followed suit, with the S&P 500, e.g., off -1.34% for the month.

June, in that sense, feels like a conventional down month (unlike May, when equities rallied despite wretched bond performance).  Defensive sectors (Telecom, Utilities) were the best performers, while more cyclically-sensitive sectors (Materials, Information Technology, Energy) were the worst.  The US outpaced the rest of the developed world (with the sole exception of Japan) in June and for the first six months of 2013, and emerging markets lagged even further behind.  US equities might not be, as we’ve suggested previously, the very best house in a bad neighborhood, but they’re not far off that mark.

The brightest spots in June’s US performance came from defensive strategy indices.  The S&P 500 Low Volatility Index actually rose (+0.60%) in June, and yield-sensitive strategies like the S&P 500 Value or the Dow Jones US Select Dividend Indices outperformed broad market gauges.  Volatility was the month’s biggest winner, as the S&P 500 VIX Short-Term Futures Index gained +7.26%.  Volatility’s performance also benefited the S&P 500 Dynamic VEQTOR Index, which allocates between stocks and vol, and rose +0.42% in June.

The posts on this blog are opinions, not advice. Please read our Disclaimers.

Only a Few Hours Left, but June’s Returns Have Not Been Seen Since 2008

Contributor Image
Kevin Horan

Former Director, Fixed Income Indices

S&P Dow Jones Indices

U.S. Treasury Bonds:
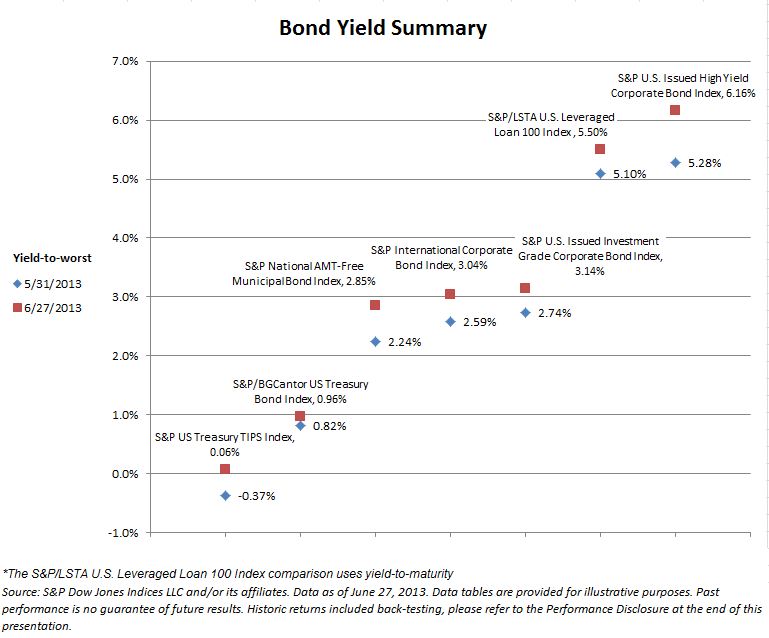
There are just a few hours of trading left to the month of June, but on the whole the month took its toll on fixed income products.  Treasuries, as measured by the S&P/BGCantor U.S. Treasury Bond Index, are down -0.91% for the month.  Year-to-date this index is returning -1.55%.  Yields are up across fixed income products as seen by the Bond Yield Summary Chart.

U.S. Corporate Bonds & Senior Loans:
Only giving up -0.83% for the month, the S&P/LSTA U.S. Leveraged Loan 100 Index stayed out of the fixed income fray and has returned a positive 1.99%, year-to-date.

After reaching a year-to-date low Option Adjusted Spread (OAS) of 378 bps on May 8, the spread for the S&P U.S. Issued High Yield Corporate Bond Index reversed direction.  Throughout June the spread rose and peaked on June 24 at 483 bps.  Since then it has come down to 464 bps.  On the month, the index is returning -2.79%. For the year it is at +0.92%.

The FOMC meeting took its toll on investment grade credit as well.  June 19 and 20 showed the two worst daily returns of -0.72% and -0.93%, respectively for the S&P U.S. Issued Investment Grade Corporate Bond IndexThe current month-to-date return of -2.71% will be the largest monthly loss since October of 2008’s -5.38%.

Bond Yield Summary


The posts on this blog are opinions, not advice. Please read our Disclaimers.

Remembering the Great Bond Rally

Contributor Image
David Blitzer

Former Managing Director and Chairman of the Index Committee

S&P Dow Jones Indices

Bond-Rally

The markets and the pundits are calling for an upturn in interest rates and announcing the end of the Great Bond Rally. Rather than lamenting the end of low interest artes, it is worth looking back at how we got here to consider the prospects going forward. The bond rally goes back decades to inflation rates and yields that sound impossible today. In the late 1970s inflation was well into double digits at 12% to 15%.  Though interest rates were rising, they were not quite keeping up with inflation so the real (inflation adjusted) cost of money was low and investors  rushed to buy houses and hard assets.  Despite repeated government efforts, inflation — and the damage it wrought on the economy — seemed unstoppable.  Paul Volcker, the newly appointed Fed chairman, led a sharp shift in Fed policy in October, 1979 which drove interest rates sky high, sent the economy into two back-to-back recessions and knocked inflation out.  Inflation dropped from 14.8% in March, 1980 to 2.6% in June, 1983.  The bank prime rate — the analogy to Libor today — peaked at 21% and in November of 1981 the Treasury sold 30 year bonds with a 14% coupon which out-performed the S&P 500 the next  year as bond yields collapsed  So much for ancient history.

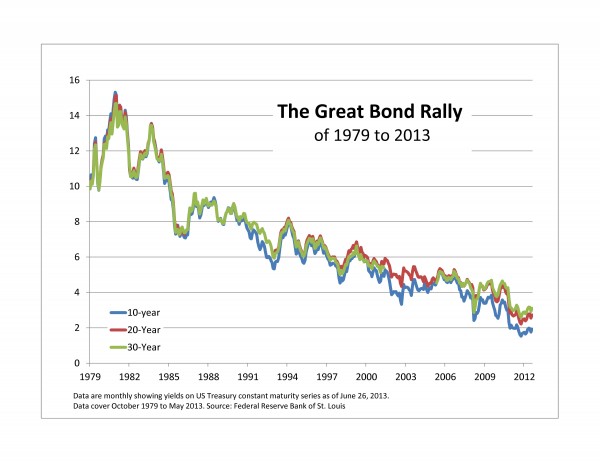
The turmoil in 1979-81 whipped inflation and sparked the bond rally that either ended last week or, hopefully, is still with us. The chart shows how long it has run and how far yields have dropped — from 14% to 2%.  The legacy the rally is more than last week’s low yields; it is the almost complete absence of inflation.  Unlike the 1970s and early 1980s, investors don’t have to constantly worry about inflation eating into their wealth or pushing bonds yields up and bond prices down.  The result is a fixed income market that responds to monetary policy and credit conditions, allowing investors to both gauge the attractiveness and hopefully profit from different fixed income assest classes. Who would look at municipal bonds were inflation at 8%, 10% or 12%.  There is no guarantee that inflation will remain low into the future, but if investors recognize the benefits of keeping price increases in control, the odds are that the Fed and others will hold inflation in check.

The Great Bond rally may, or may not, be fading, but its legacy of low inflation is with us to the benefit of fixed income investing.

The posts on this blog are opinions, not advice. Please read our Disclaimers.