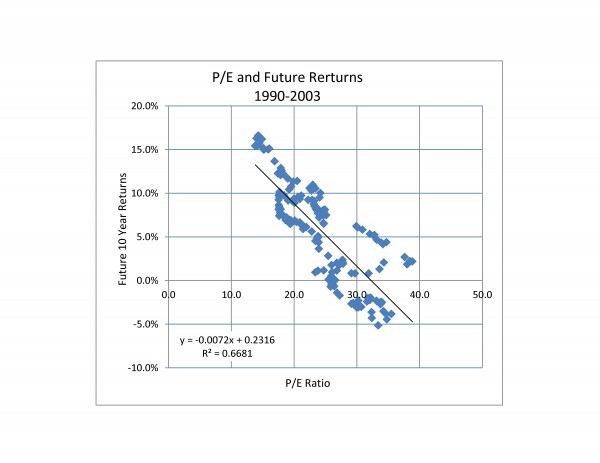
The chart below is a scatter diagram comparing the P/E ratio to the price return on the S&P 500 over the next ten years. P/E is defined as each month’s level of the S&P 500 divided by the earnings per share on the 500 over the trailing 12 months. Both the P/E and the index level are data, not forecasts. The return over the next ten year is the index level ten years into the future divided by the index level used in the P/E calculation and stated as an annual return. Since we want to look ten years into the future, the most recent data is April, 2003.

Before trying to forecast the market with the chart, remember that past performance is no guarantee of future returns. Further, the chart is based on the period from 1990 to 2003 so it doesn’t include such notable bits of history as the 2008 bear market or the 1987 market crash. Further, the statistics indicate that the P/E ratio only explains about two-thirds of the changes in market returns — not enough for a reliable guess about the future.
The posts on this blog are opinions, not advice. Please read our Disclaimers.


