In January 2003, S&P Dow Jones Indices introduced the world’s first equal-weighted index, the S&P 500® Equal Weight Index, leading the way for the subsequent development of non-market-cap weighted indices.[1] Since then, looking at the index’s historical back-tested performance, it outperformed its market-cap-weighted counterpart, the S&P 500, in 16 out of 28 years, with an annualized excess return of 1.44% per year.[2]
In addition to better relative performance, equal weighting can have fundamental appeal for market participants who subscribe to the notion that market-cap weighting exhibits momentum bias, with winners getting a larger weight in the index, and potentially leading to concentration and overvaluation issues. Therefore, for those who wish to reduce concentration risk or to separate the price of a security from its fundamentals, an equal-weight index can offer an alternative approach.
Moreover, equal-weight indexing could hit closer to home for proponents of passive indexing, given that its investment underpinning runs counter to active investing. While active management seeks to exploit risk and return expectations of securities through a superior selection process and diversified portfolio construction, equal-weight indexing assumes that all the securities in the universe have the same expected returns and volatility. In other words, by equal weighting, we assume that an average investor has no forecasting ability or is unable to distinguish securities’ returns and volatilities.
Therefore, one can argue that the lack of return, risk, and covariance matrix assumptions in an equal-weighted index makes it a natural benchmark against actively managed funds that incorporate all those expectations. In fact, several studies have shown that an alpha-generating strategy should be able to outperform an equal-weight benchmark.[3]
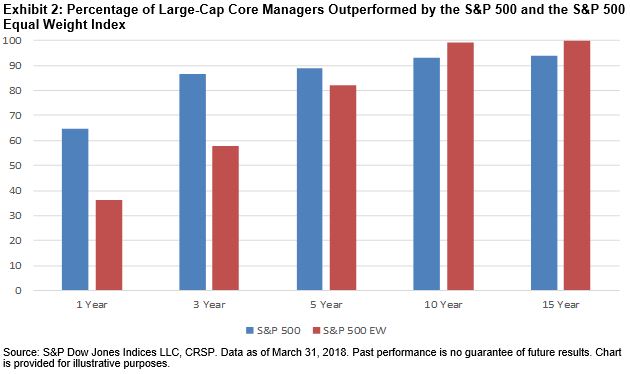
Against that backdrop, we compare the performance of actively managed U.S. large-cap and large-cap core funds with the S&P 500 Equal Weight Index (see Exhibits 1 and 2) as of March 31, 2018.[4] As we can see below, over the near-term horizons (one, three, and five years), a higher percentage of large-cap funds underperformed the S&P 500 than the S&P 500 Equal Weight Index, primarily due to mega-cap securities performing well in the large-cap space and contributing significantly to the S&P 500 returns over the past two years.
However, over the long-term investment horizons (10 or 15 years), a greater percentage of large-cap funds underperformed the S&P 500 Equal Weight Index than the S&P 500. In fact, the 15-year figures paint a difficult landscape in which close to 100% of large-cap managers underperformed the S&P 500 Equal Weight Index.

Our analysis shows that the S&P 500 Equal Weight Index set a higher threshold for managers to outperform in the long run. In a subsequent blog, we will look at the underlying risk factor exposures of the S&P 500 Equal Weight Index and present a framework in which the index can serve as a supplementary benchmark to evaluate large-cap managers.
[1] Zeng, L. and Luo, F. “10 Years Later: Where in the World is Equal Weight Indexing Now?” S&P Dow Jones Indices LLC. April 2013.
[2] Calendar year returns were calculated from 1990 through 2017. Annualized excess returns were computed from Jan. 31, 1990, to May 31, 2018. Past performance is no guarantee of future results. Hypothetical performance is used.
[3] Edwards, T. and Lazzara, C. “Equal-Weight Benchmarking: Raising the Monkey Bars.” S&P Dow Jones Indices LLC. May 2014.
[4] For our analysis, the underlying data source was the University of Chicago’s Center for Research in Security Prices (CRSP) Survivorship-Bias-Free US Mutual Fund Database, which is the same source used by the headline SPIVA® U.S. Scorecard.
The posts on this blog are opinions, not advice. Please read our Disclaimers.