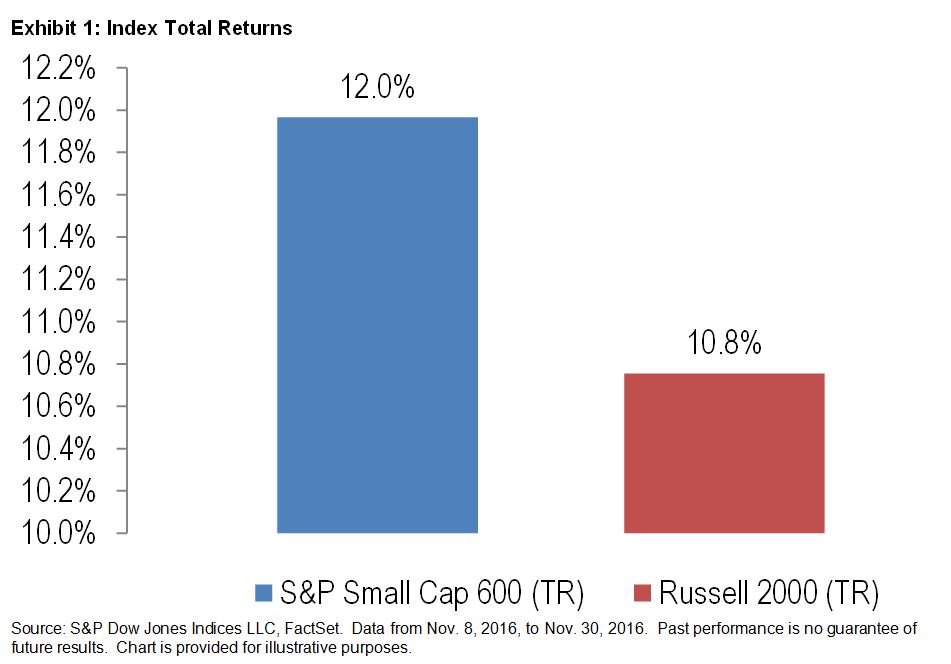
Much has been written about the performance differential between the two leading small-cap indices, the S&P SmallCap 600® and Russell 2000. Over a long-term investment horizon, the S&P SmallCap 600 has outperformed the Russell 2000 with less risk. Part of the performance differential can be attributed to the June Russell rebalancing effect. As winners from the Russell 2000 graduate to the Russell 1000 and losers from the Russell 1000 move down to the small-cap index, fund managers are forced to sell winners and buy losers, thereby creating a negative momentum portfolio (Furey 2001).
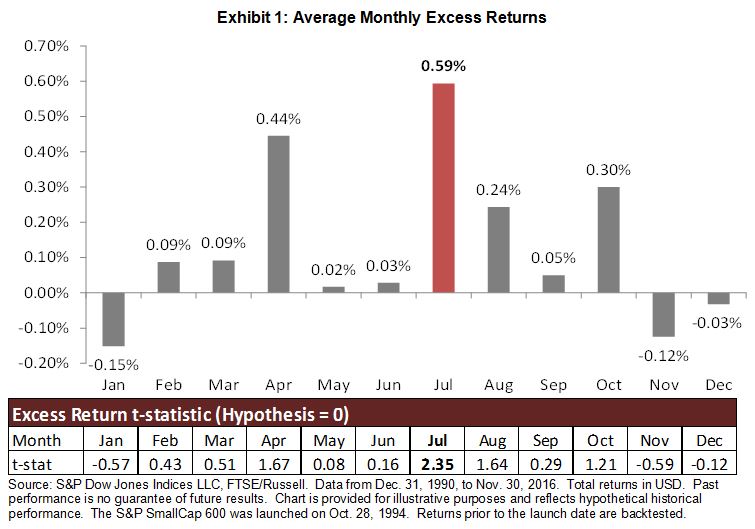
We looked at the average monthly excess returns of the S&P SmallCap 600 over the Russell 2000 from January 1994 through Nov. 30, 2016, and grouped them by calendar months. Average monthly excess returns for July are higher than any other month, and this is found to be statistically significant (see Exhibit 1). It should be noted that July is the only calendar month to have a statistically significant t-Stat.
In our recent research study, we showed that the June rebalancing effect only accounts for approximately one-half of the long-term excess returns (A Tale of Two Benchmarks). Unlike the Russell 2000, the S&P SmallCap 600 requires companies to meet financial viability criteria to be eligible for inclusion. The financial viability rule requires that the sum of the most recent four consecutive quarters’ as-reported earnings be positive, as well as the as-reported earnings of the most recent quarter. This profitability measure can be considered as a proxy for quality. Research has shown that higher-quality companies, on average, outperformed lower-quality companies over a long-term investment horizon.
Below, we show that profitability screening plays a role in driving the returns of the S&P SmallCap 600. We tested a universe of U.S small-cap stocks[1] with a market cap between USD 200 million and USD 2 billion and divided the securities into two groups.[2]
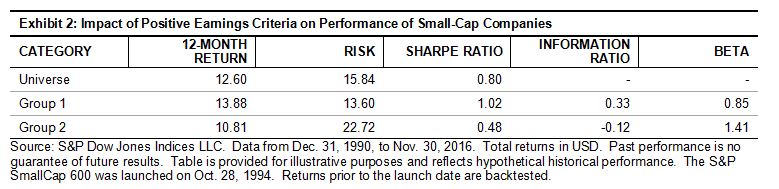
- Group 1 consisted of securities for which the sum of the most recent four consecutive quarters’ as-reported earnings and the most recent quarter EPS were positive.
- Group 2 consisted of securities for which the sum of the most recent four consecutive quarters’ as-reported earnings and the most recent quarter EPS were not positive.
As shown in Exhibit 2, Group 1 outperformed Group 2 as well as the overall small-cap universe with lower volatility, resulting in a higher Sharpe ratio. The positive information ratio of Group 1 also highlights that small-cap companies with profitability characteristics were able to generate higher excess returns over the benchmark (the small-cap universe in this case) on a consistent basis. It is also worth noting that these companies had lower beta to the market as well.
Our analysis shows that the profitability or quality factor plays a meaningful role in cross-sectional dispersion of small-cap stocks’ returns. Companies with strong profitability measures outperformed those without during the back-tested period. The live performance record of the small-cap indices can attest to the role of the quality factor as a key return driver among small-cap stocks, as the S&P SmallCap 600 has outperformed the Russell 2000 since inception and with lower volatility.[3]