The central bank of England has said that the European Union referendum in June 2016 is the most significant near-term domestic risk to the country’s financial stability. Because of its separate currency, Britain is one of the countries that could disassociate itself most easily from the EU. It is a long time until June, and the question lingers: is this another Scotland situation with a heavy amount of press, but in which case, like Scotland, the U.K. will stay just where it is?
The “Brexit,” as it is being called, could have varying consequences, depending on the terms of a departure agreement. Such terms would be negotiated after the vote. To try and predict the outcome is sheer madness, as they say. The decision will rely upon prevailing economics, future outlook, crowd sentimentality, and many other factors.
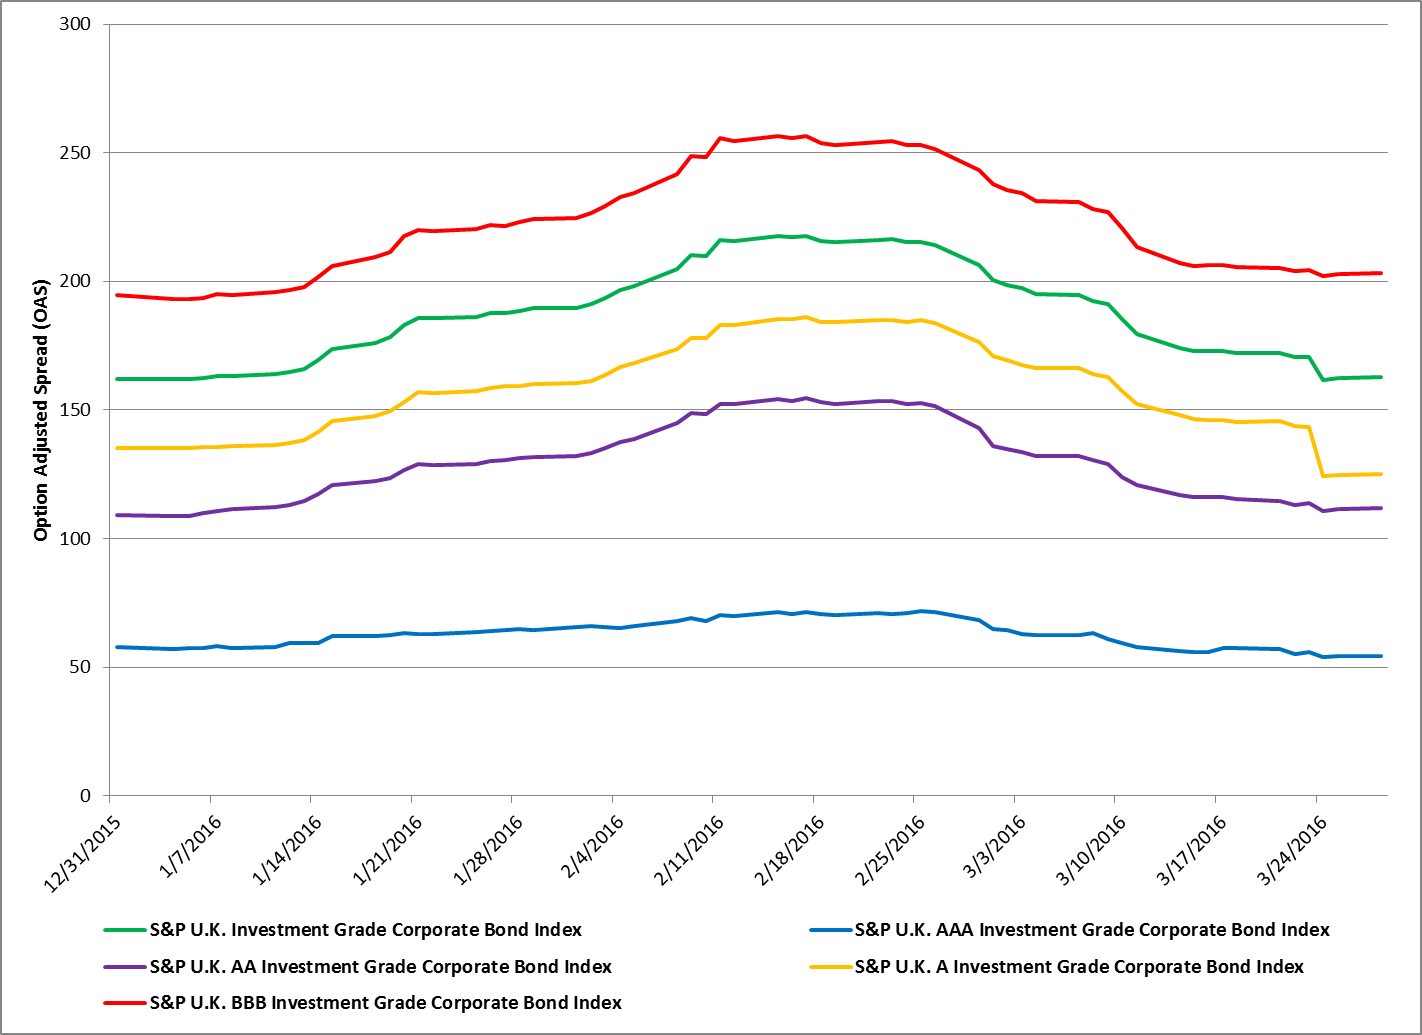
What can be observed from S&P Dow Jones Indices is the following.
- K. corporate bonds reached their widest spread for the year on Feb. 17, 2016, as the S&P U.K. Investment Grade Corporate Bond Index reached an option-adjusted spread of 218 bps (see Exhibit 1).
- K. corporate bonds had been tightening in spread ahead of the March 10, 2016, European rate cut.
- Since the EU rate cut, all U.K. corporate spreads have been tighter, with the S&P U.K. A Investment Grade Corporate Bond Index performing the best, at 32 bps lower.
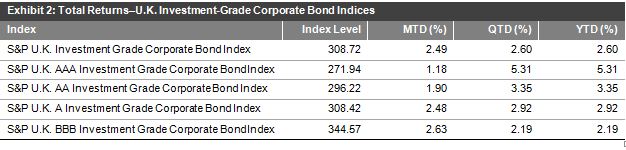
- The S&P U.K. Investment Grade Corporate Bond Index has returned 50 bps more in total return than the S&P Eurozone Investment Grade Corporate Bond Index (2.6% versus 2.1%, respectively).
- AAA U.K. investment-grade corporate bonds have returned 5.31% YTD. However, as discussions continue on the possible outcome of the “Brexit,” investors have moved back into risk, and the BBB corporates have returned 2.63% for the month, as of March 28, 2016 (see Exhibit 2).
Exhibit 1: Option-Adjusted Spread History–U.K. Investment-Grade Corporate Bond Indices