



Get Indexology® Blog updates via email.

In This List

Introducing the S&P 500 & HKEX Tech 100 Index: A Complementary Tech-Focused Blend

Introducing the S&P Kaiko Digital Asset Indices

Taking the Pulse: What Private Wealth Managers Are Saying in the S&P DJI Market Sentiment Survey for Wealth Indices (Q3 2026)

Quality and Diversification across Developed Markets outside the U.S.

Financial Viability: What Drives the S&P Pantera Digital Asset Index

Introducing the S&P 500 & HKEX Tech 100 Index: A Complementary Tech-Focused Blend

Contributor Image
Sean Freer

Director, Global Exchange Indices

S&P Dow Jones Indices

The S&P 500® & HKEX Tech 100 Index combines Hong Kong-listed technology and innovation leaders and U.S. large caps within a single, rules-based benchmark. Its focus is on targeted growth from Hong Kong and China’s most innovative technology-oriented sectors while benefiting from the scale, sector breadth and liquidity of the S&P 500.

Launched on Sept. 30, 2026, this blended “index of indices” gives a weight of 62% to the HKEX Tech 100 Index and 38% to the S&P 500, with quarterly rebalancing. The index design is based on eligibility for the HKEX ETF Connect program.

The HKEX Tech 100 Index

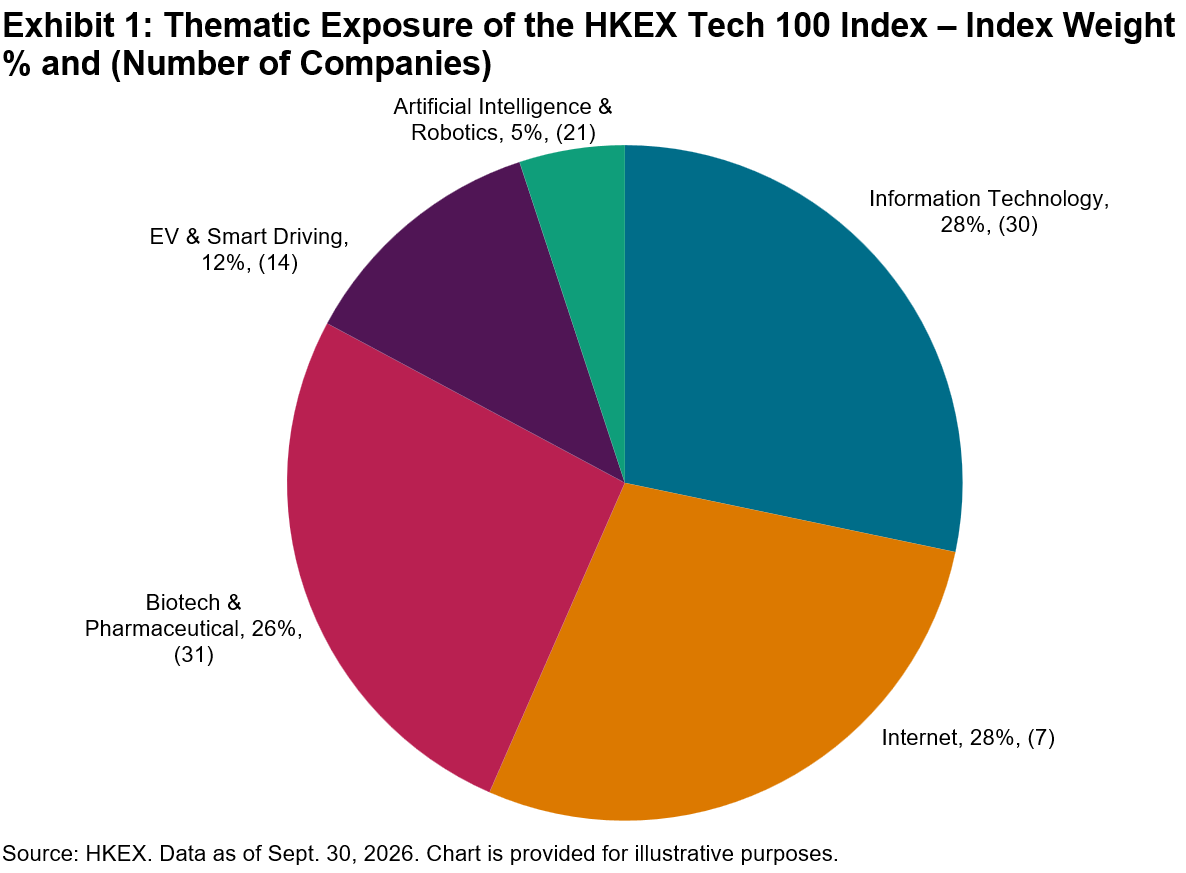
As Hong Kong’s equity market continues to grow and evolve, technology- and innovation-driven companies are playing an increasingly important role. The HKEX Tech 100 Index reflects the performance of leading and emerging companies whose revenues are aligned with high-growth themes across Artificial Intelligence, Biotech & Pharmaceutical, Electric Vehicles & Smart Driving, Internet, Information Technology (IT) and Robotics. Industry (25%) and single-stock (8%) caps help mitigate concentration risk while maintaining meaningful weights in innovation leaders such as Tencent, Alibaba, Xiaomi and BYD.

The HKEX Tech 100 Index incorporates a fast-entry mechanism and quarterly adjustment to facilitate the timely inclusion of newly listed stocks if ranked in the top 35 by free float market capitalization and eligible for Southbound Stock Connect.
Why Add the S&P 500 to the Mix?

The S&P 500 component adds U.S. large-cap equities to the Hong Kong-listed universe, extending the blended index’s coverage across markets and sectors.

The S&P 500 is widely regarded as a leading gauge of U.S. large-cap equities. It includes 500 leading companies and covers approximately 85% of the U.S. equity market and more than half of global equity market capitalization. At year-end 2025, more than USD 23 trillion1 in assets was benchmarked or indexed to the S&P 500 across passive and active strategies, supporting efficient implementation and a highly liquid trading ecosystem.

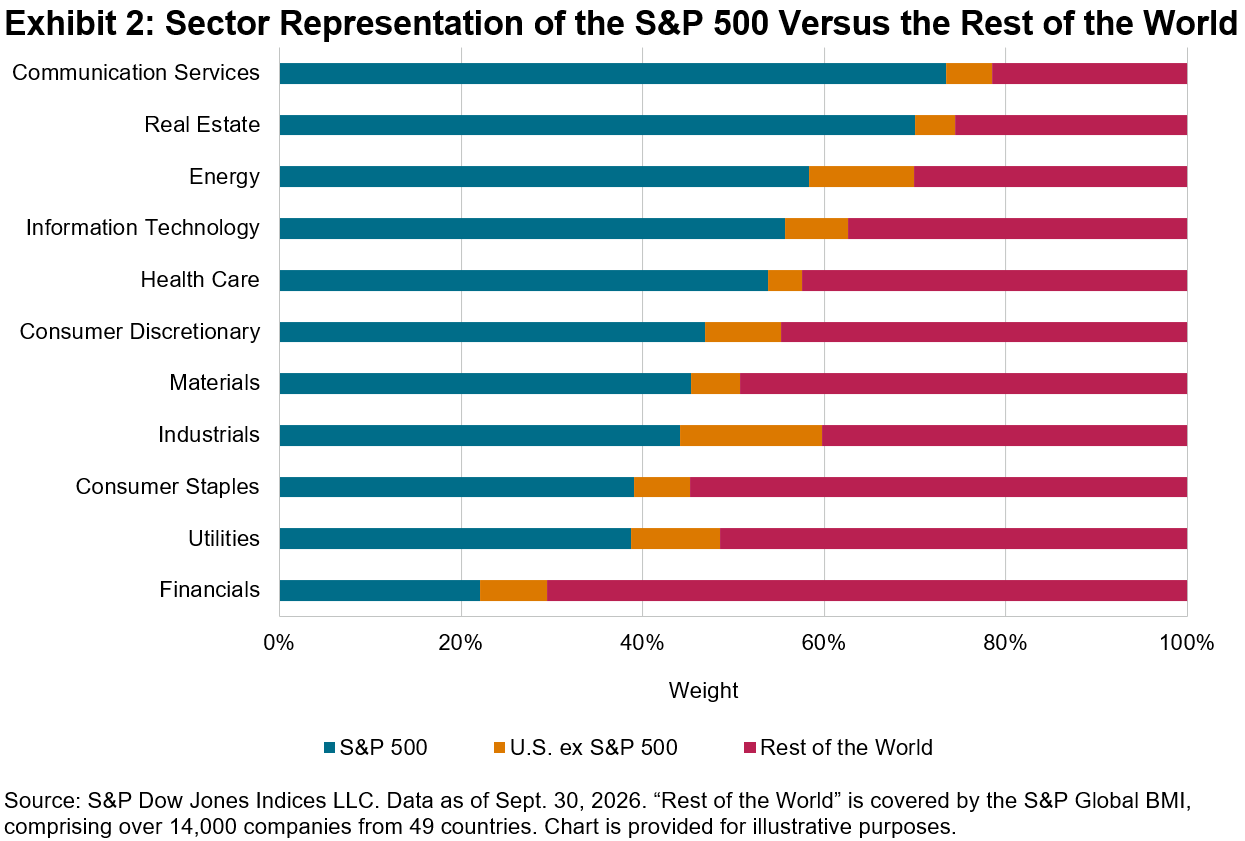
A key characteristic of the S&P 500 is its broad sector coverage, reflecting the U.S. large-cap equity market. Although its industry and constituent composition evolves over time, the index has maintained a dominant global presence in several sectors. As of Sept. 30, 2026, Information Technology (including Nvidia, Apple and Microsoft) and Communication Services (including Alphabet, Meta and Netflix) represented 39.7% and 9.9% of the S&P 500, respectively. S&P 500 constituents in these sectors accounted for 55.7% and 73.4% of their respective global equity market capitalization, as represented by the S&P Global Broad Market Index (BMI). The S&P 500’s Real Estate, Energy and Health Care sectors also accounted for more than 50% of their respective global market capitalization.
The S&P 500 & HKEX Tech 100 Index: Sector Diversification in a 62/38 Blend

The S&P 500 & HKEX Tech 100 Index brings together two distinct equity markets with relatively low historical correlation in a single benchmark. The S&P 500 aligns with the tech-oriented growth theme via sectors such as Information Technology, Communication Services and Consumer Discretionary (which includes Amazon and Tesla). It also provides meaningful representation of traditionally non-tech sectors such as Financials, Industrials, Energy and Consumer Staples. The broader sector coverage complements the targeted technology and innovation approach of the HKEX Tech 100 Index.

By pairing broad representation of large- and mid-cap technology companies listed in Hong Kong and eligible for Southbound Stock Connect with U.S. large-cap equities, the S&P 500 & HKEX Tech 100 Index is more diversified while maintaining a meaningful focus on tech-driven growth.
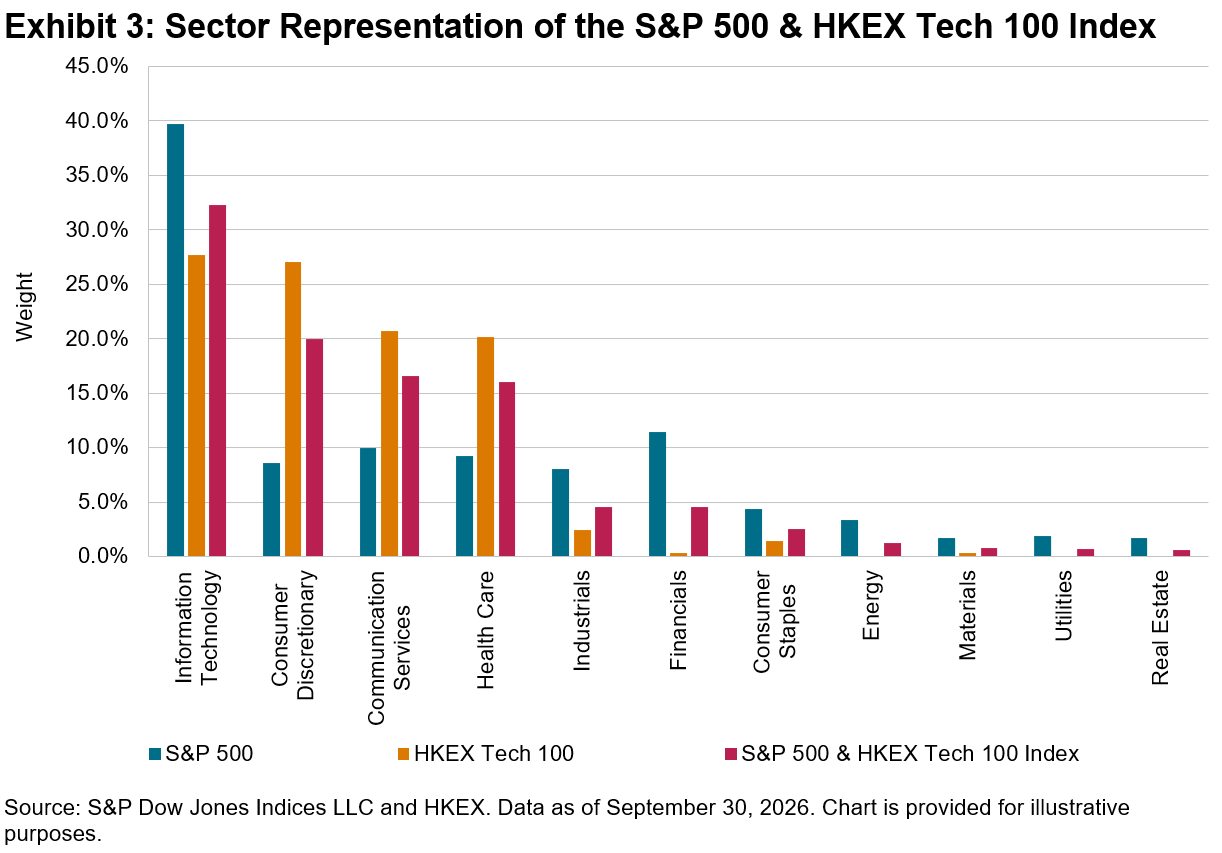
The three-year historical correlation between the S&P 500 and the HKEX Tech 100 Index averaged below 0.20, based on monthly performance. This relatively low correlation suggests that the two markets have historically responded to different performance drivers and have experienced differing market cycles.

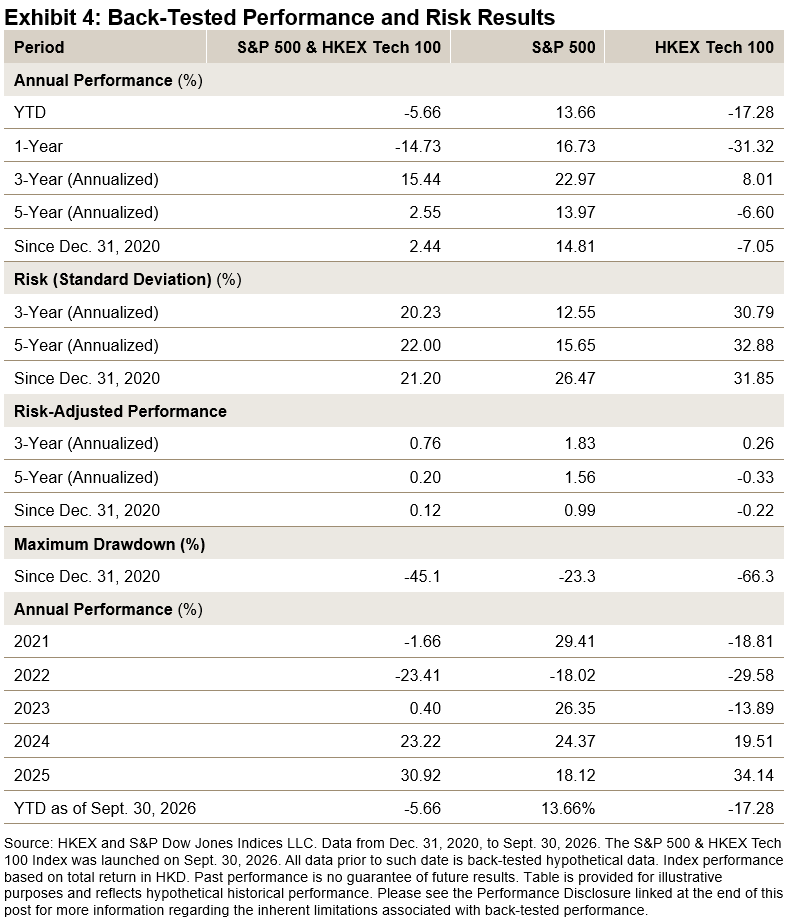
Combining the S&P 500 with the HKEX Tech 100 Index reduced volatility and drawdowns relative to the standalone HKEX Tech 100 Index. Over the back-tested period from Dec. 31, 2020, to Sept. 30, 2026, the blended index showed a materially lower maximum drawdown and lower longer-term volatility.
Conclusion

The S&P 500 & HKEX Tech 100 Index brings together two complementary market segments within a single benchmark. It combines Hong Kong-listed technology and innovation companies with the broader sector coverage and scale of the U.S. large-cap market.

The low historical correlation between the two underlying indices underscores the potential diversification of the 62/38 weighting, which historically reduced volatility while retaining a meaningful focus on technology-driven growth. With quarterly rebalancing, Southbound ETF Connect eligibility and calculation in both HKD and USD, the index is a versatile benchmark for tracking the next wave of technology-driven growth across multiple sectors in China and abroad.

1 S&P Dow Jones Indices Annual Survey of Assets, Dec. 31, 2025.

The posts on this blog are opinions, not advice. Please read our Disclaimers.

Introducing the S&P Kaiko Digital Asset Indices

Contributor Image
Sherifa Issifu

Associate Director, Global Exchanges

S&P Dow Jones Indices

Combining Institutional and Crypto-Native Indexing Expertise

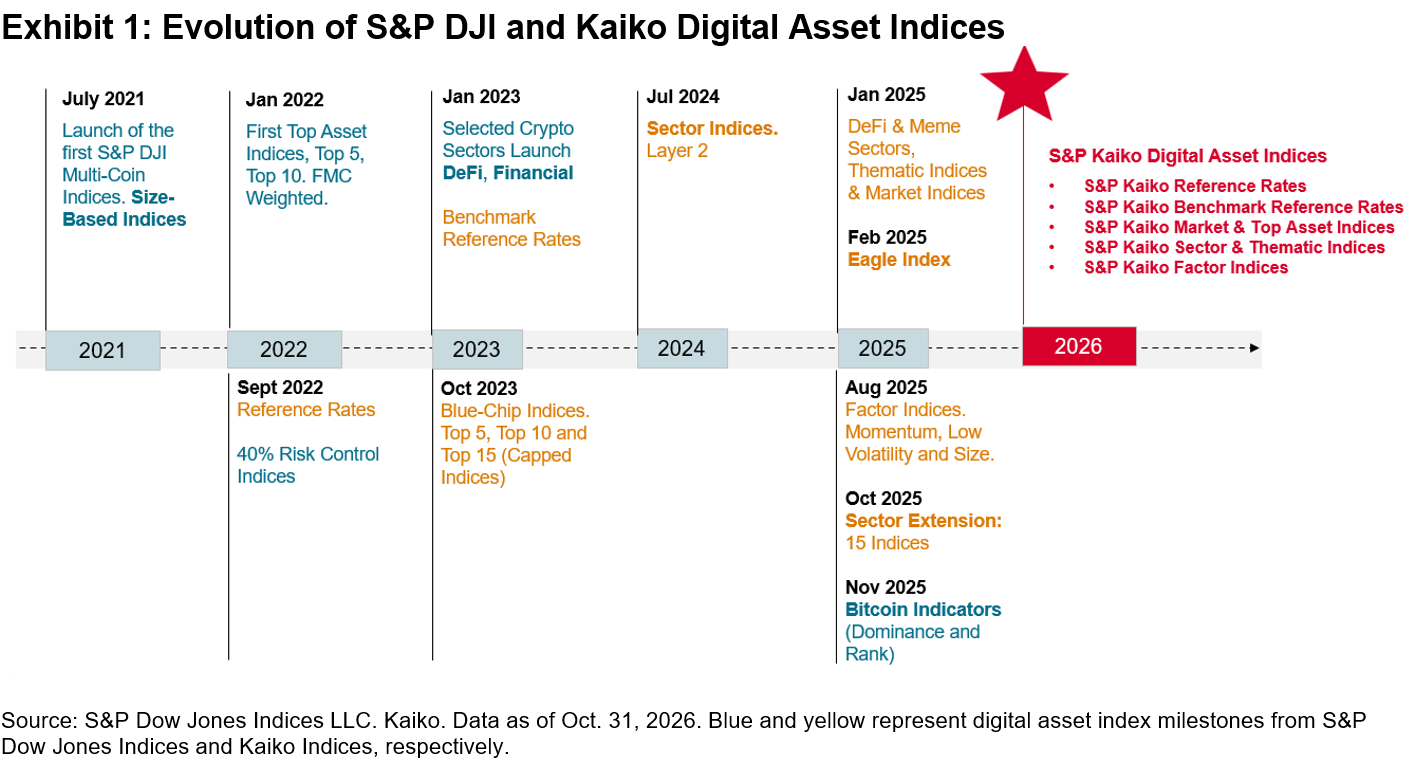
2026 has marked a significant milestone for S&P Dow Jones Indices (S&P DJI) in digital asset markets. In early September, S&P DJI announced the integration of the S&P Digital Asset Indices with Kaiko’s Digital Asset Indices1 into a unified framework.

Exhibit 1 demonstrates the multi-year commitment of S&P DJI and Kaiko to crypto indexing, including the development of indices across various market segments, from single-asset indices to multi-coin basket strategies, as well as specialized segment indices by sector and factor. Crypto indexing is evolving in a manner similar to traditional indexing in other asset classes, providing a comprehensive set of building blocks for reflecting different market views.

Single-Coin/Asset Indices

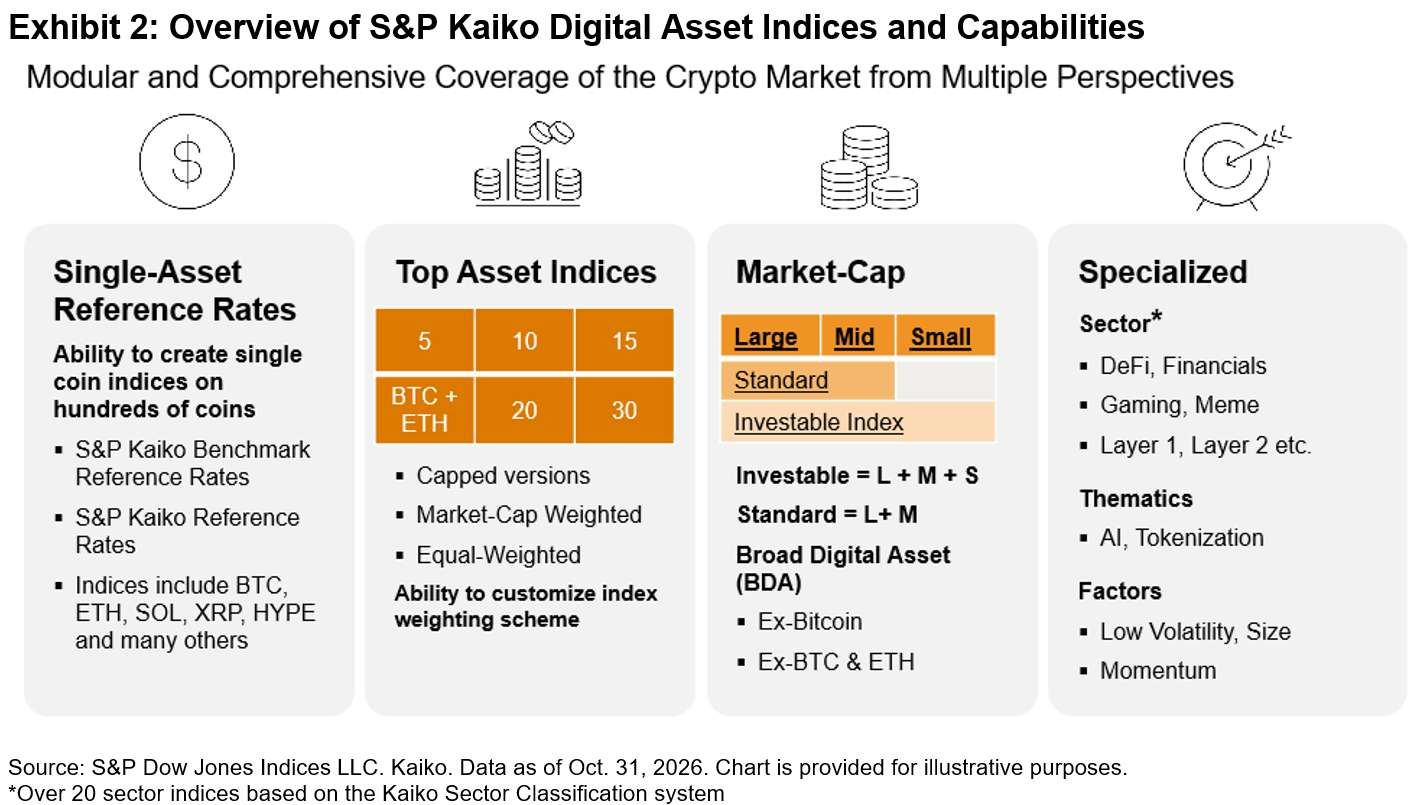
As of October 2026, the S&P Kaiko Digital Asset Indices offer two types of single-coin reference rates: S&P Kaiko Single-Asset Reference Rates (RFR) and S&P Kaiko Single-Asset Benchmark Reference Rates (BRR). The standard reference rates use a minimum of one vetted exchange in the calculation of prices, while the benchmark reference rates require a minimum of three vetted exchanges used in the price calculation. These options address varying levels of rigor needed by index users. Exchange-traded funds and traditional futures typically require higher pricing rigor, which may limit the number of eligible assets and result in pricing differences. Standard reference rates provide continuous pricing and are primarily used for perpetuals and other crypto-native product wrappers.

Similar to traditional indexing, there is an increased need for customization in crypto indices, including selection of exchanges, currency pairs (fiat versus stablecoins such as USDC and USDT), calculation window, lookback period and calculation frequency. These customizations allow reference rates to align with client requirements.

Size-Based Indices: Top Assets and Market Cap

In the multi-coin space, the S&P Kaiko Digital Asset Indices offer indices for both index-linked products and active managers seeking to outperform benchmarks. The S&P Cryptocurrency Broad Digital Asset (BDA) Index2 and investable indices are segmented by the largest 5, 10, 15, 20 or 30 assets. In addition to the top asset indices, the series includes a range of indices that exclude the largest assets such as Bitcoin (BTC) and Ethereum (ETH) with a focus on “altcoins.” The S&P Kaiko Digital Asset Indices are also offered in alternative weighting schemes such as equal weighting, capped percentages (e.g., 30% or 35%) or dual capping to mitigate concentration in single assets.

Specialized Indices: Sectors, Thematics and Factors

Specialized multi-coin indices are offered in recognition that cryptocurrencies serve different use cases and may exhibit distinct performance characteristics. For example, the DeFi and Financials sectors may perform differently from the Gaming sector. Kaiko’s sector classifications, similar to GICS®, follow a one-to-one mapping. Thematic strategies group indices by themes such as tokenization and AI. Factor indices include price-based factors and crypto-native fundamentals, such as low volatility, momentum and size. Notably, the momentum factor in crypto turns over faster, requiring monthly rebalancing instead of the standard quarterly schedule to reflect changing market dynamics.

Because crypto trades continuously (24/7), without a natural end-of-day, assessments for exchange-traded products need to align with regional market conventions. The combined capabilities of S&P DJI and Kaiko support the needs of both traditional and crypto-native clients. All indices are available in four versions: APAC (16:00 Singapore), EMEA (16:00 London), Americas (16:00 New York) and real-time, providing global coverage with the ability to customize to alternative times and currencies.

Conclusion

S&P DJI offers comprehensive index solutions across asset classes. In collaboration with Kaiko, the S&P Kaiko Digital Asset Indices apply institutional standards to digital assets. For more information, please see our brochure, press release and investment theme page.

1 S&P Dow Jones Indices and Kaiko Introduce S&P Kaiko Digital Asset Indices, Sept. 1, 2026.

2 To be renamed S&P Kaiko Broad Digital Asset Index from Dec. 18, 2026.

The posts on this blog are opinions, not advice. Please read our Disclaimers.
Taking the Pulse: What Private Wealth Managers Are Saying in the S&P DJI Market Sentiment Survey for Wealth Indices (Q3 2026)

Contributor Image
Daniel Hurdley

Managing Director, ARC Research

S&P Dow Jones Indices

Private wealth managers sit at the intersection of market narratives and real-world client implementation. Their views can offer insight into how risk appetite and portfolio preferences are evolving, particularly when measured consistently over time.

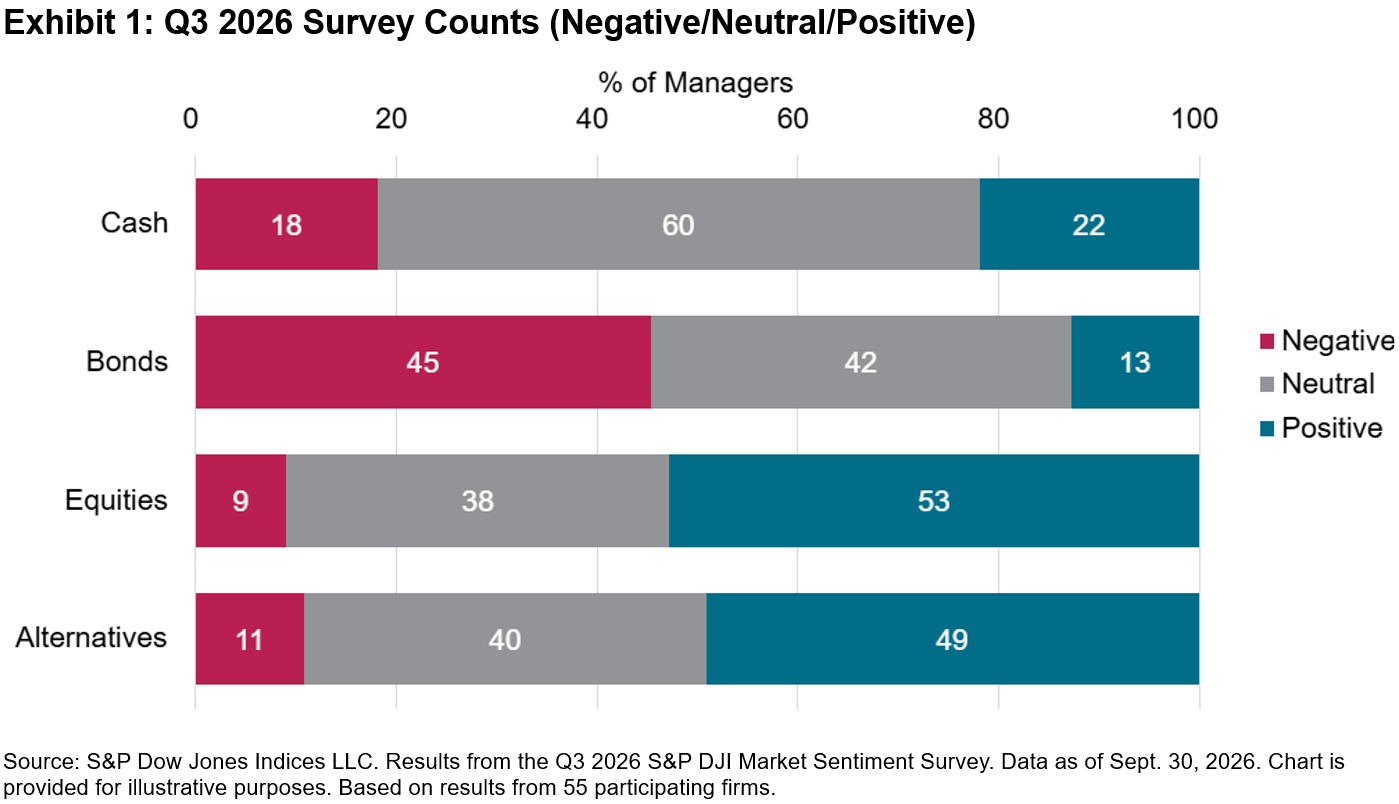
In the latest S&P DJI Market Sentiment Survey for Wealth Indices (64th edition), 55 firms shared their 12-month outlook across major asset classes and other portfolio positioning questions. In this blog, we highlight a few headline takeaways and one notable deeper theme on domestic equity exposure that continues to develop.

Asset Class Sentiment—Equities Still Lead, Bonds Remain Out of Favor

At the headline level, equities remain the clear favorite, with alternatives also strongly supported. Bonds continue to be the least favored asset class, while cash sentiment is mixed (notably with a meaningful neutral camp).

Overall, this keeps the story consistent with recent quarters: managers appear willing to take risk primarily via public equities and liquid diversifiers, while remaining cautious on “traditional” fixed income at the broad asset class level.

Beneath the Headline: Domestic Equity Exposure Remains Structurally Low

This quarter, we revisited a question we last asked in 2024 regarding four risk profiles: Cautious, Balanced Asset, Steady Growth and Equity Risk:

At a Strategic Asset Allocation level, what is the approximate domestic equity exposure (as a proportion of overall equity exposure) for each of the four risk profiles?

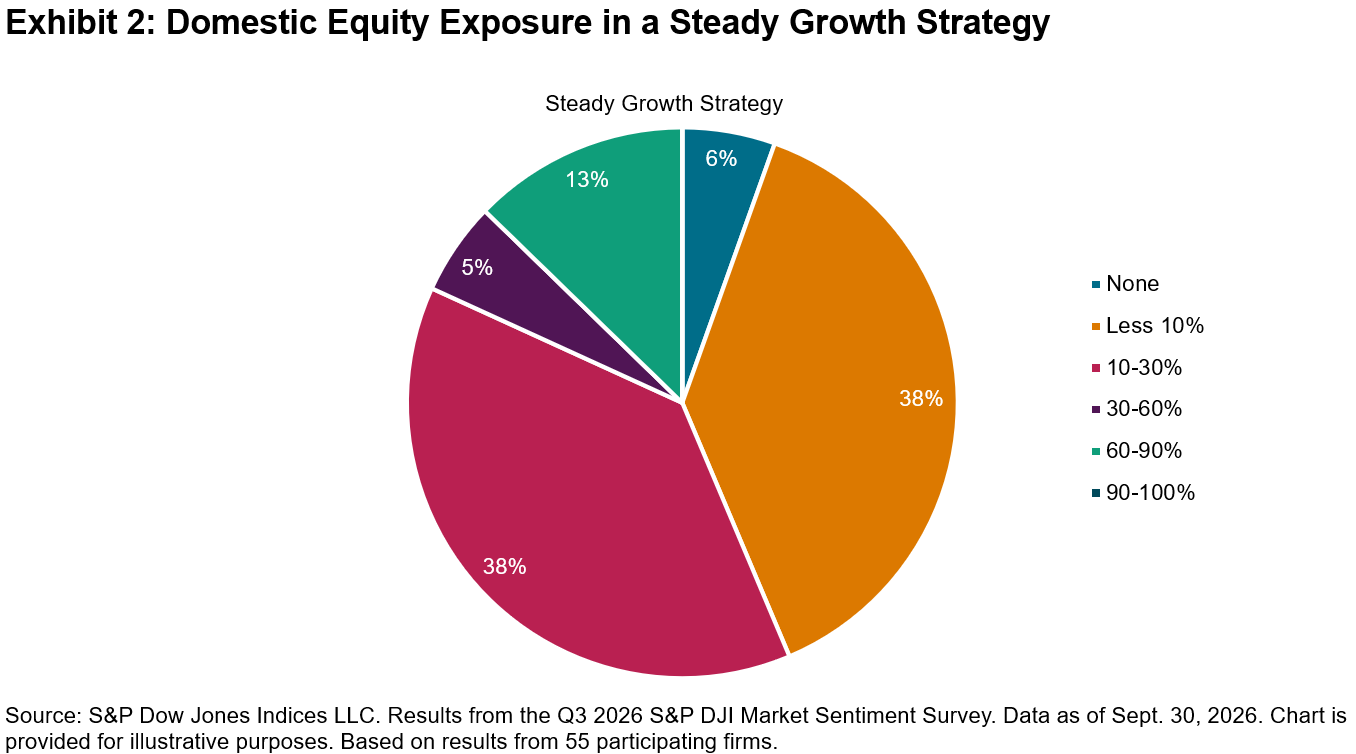
For Steady Growth mandates, the message is consistent and fairly structural: domestic equity exposure is typically a minority share of overall equity exposure.

Key Takeaways

  • The “below 30%” outcome dominates: In Q3 2026, 82% of Steady Growth portfolios held less than 30% domestic equity exposure (as a share of overall equity exposure).
  • A continued shift toward the very low end: Within that sub-30% bucket, “less than 10%” allocations have become more prevalent, and the split between “less than 10%” and “10-30%” is now almost equal, pointing to a further retreat from moderate domestic allocations versus 2024.
  • Five-year direction of travel supports diversification: Across the broader five-year view, managers are still more likely to report reducing domestic exposure than increasing it, reinforcing the same diversification narrative that shows up in Steady Growth mandates now.

How to Access the Full Report

The full survey includes the additional detail behind these headlines; full breakdowns across regions, sectors and currencies; plus conviction shifts versus prior periods. As with prior quarters, access to the full report is reserved for investment managers who complete the survey. Find out more on our website.

This content may be AI-assisted and is composed, reviewed, edited, and approved by S&P Global.

The posts on this blog are opinions, not advice. Please read our Disclaimers.

Quality and Diversification across Developed Markets outside the U.S.

Contributor Image
Wenli Bill Hao

Director, Factors and Dividends Indices, Product Management and Development

S&P Dow Jones Indices

Sovereign bond yields have climbed to their highest levels in a decade across several major international markets, driven by elevated global energy prices and persistent inflation. As higher risk-free rates can weigh on equity valuations and raise the cost of capital, market participants may place greater emphasis on companies with strong profitability, higher-quality earnings and sound balance sheets.

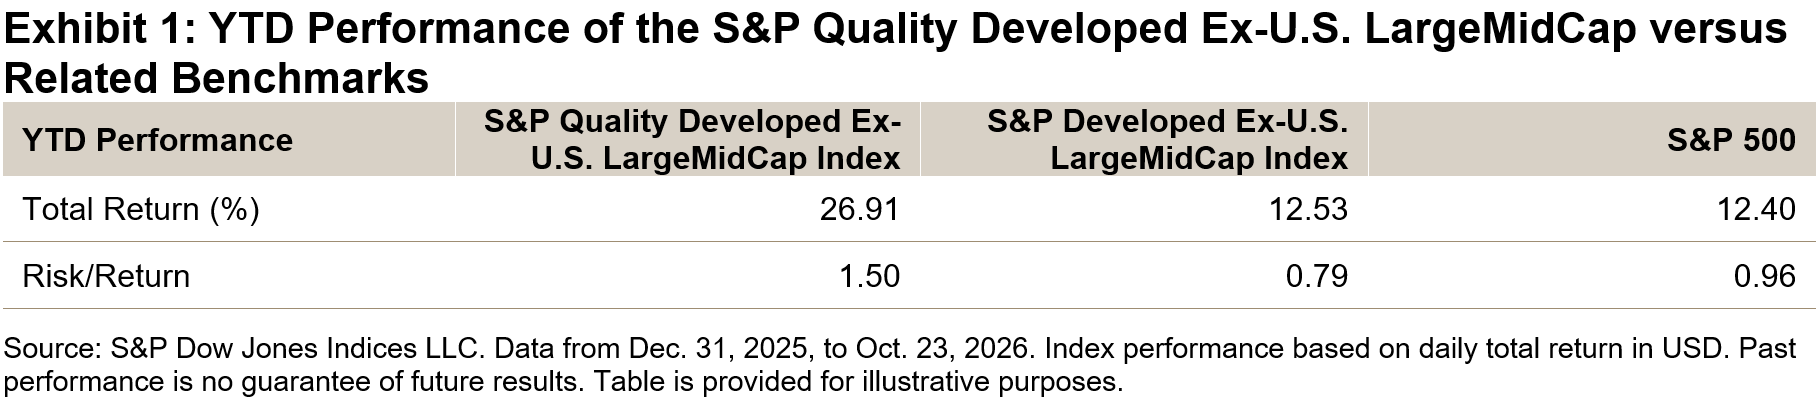
Against this backdrop, the S&P Quality Developed Ex-U.S. LargeMidCap Index has outperformed its benchmark YTD through Oct. 23, 2026.

Performance

As shown in Exhibit 1, the S&P Quality Developed Ex-U.S. LargeMidCap Index outperformed its underlying benchmark by about 14% YTD. This result is consistent with the index’s longer-term track record and highlights the historical performance characteristics of a quality-focused strategy. The index also outperformed the broad U.S. equity market, as represented by the S&P 500®.

Methodology Overview

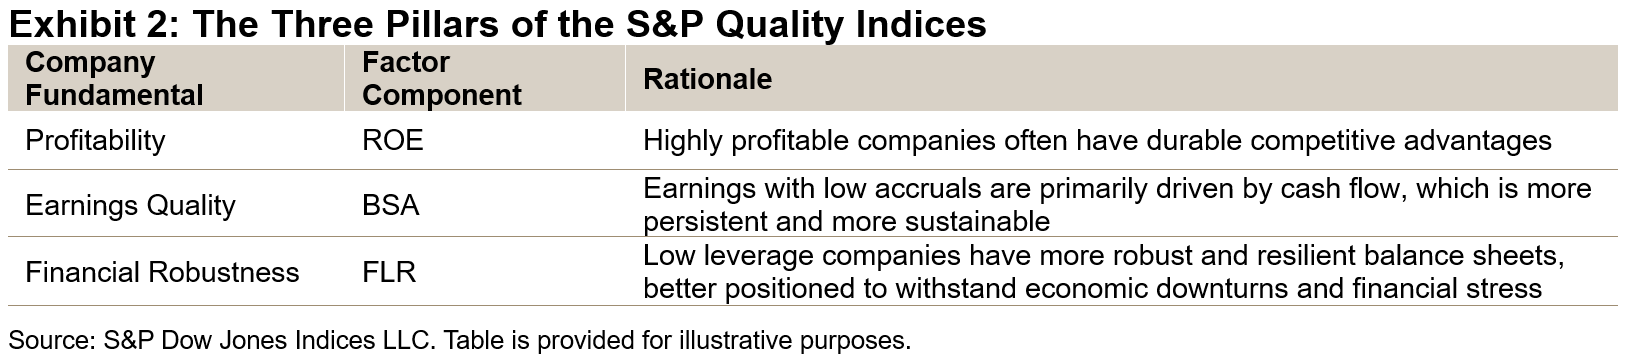
Higher quality companies may exhibit strong and stable profitability, sustained earnings growth, robust cash flows and prudent capital structures. The S&P Quality Indices assess these characteristics using three key metrics, shown in Exhibit 2: return on equity (ROE), the balance sheet accruals ratio (BSA) and the financial leverage ratio (FLR). Each metric offers a distinct perspective on a company’s overall quality.

The S&P Quality Developed Ex-U.S. LargeMidCap Index measures the performance of high-quality companies across developed markets outside the U.S. Its selection process identifies the top 20% of eligible stocks based on their quality scores. Constituents are then weighed by the product of their float market capitalization and quality scores, subject to constraints.1

Long-Term Outperformance

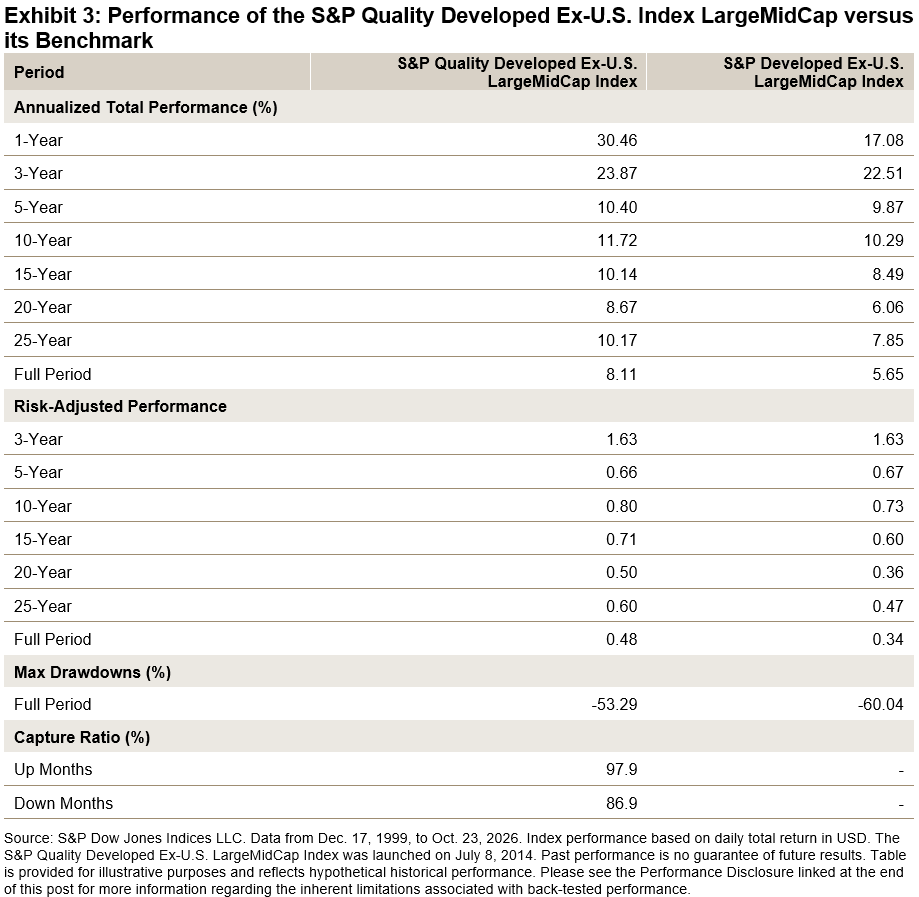
Across both short- and long-term horizons, the S&P Quality Developed Ex-U.S. LargeMidCap Index has outperformed its benchmark. The index has also historically exhibited defensive characteristics, including lower drawdowns and lower downside capture.

Performance across Economic Cycles

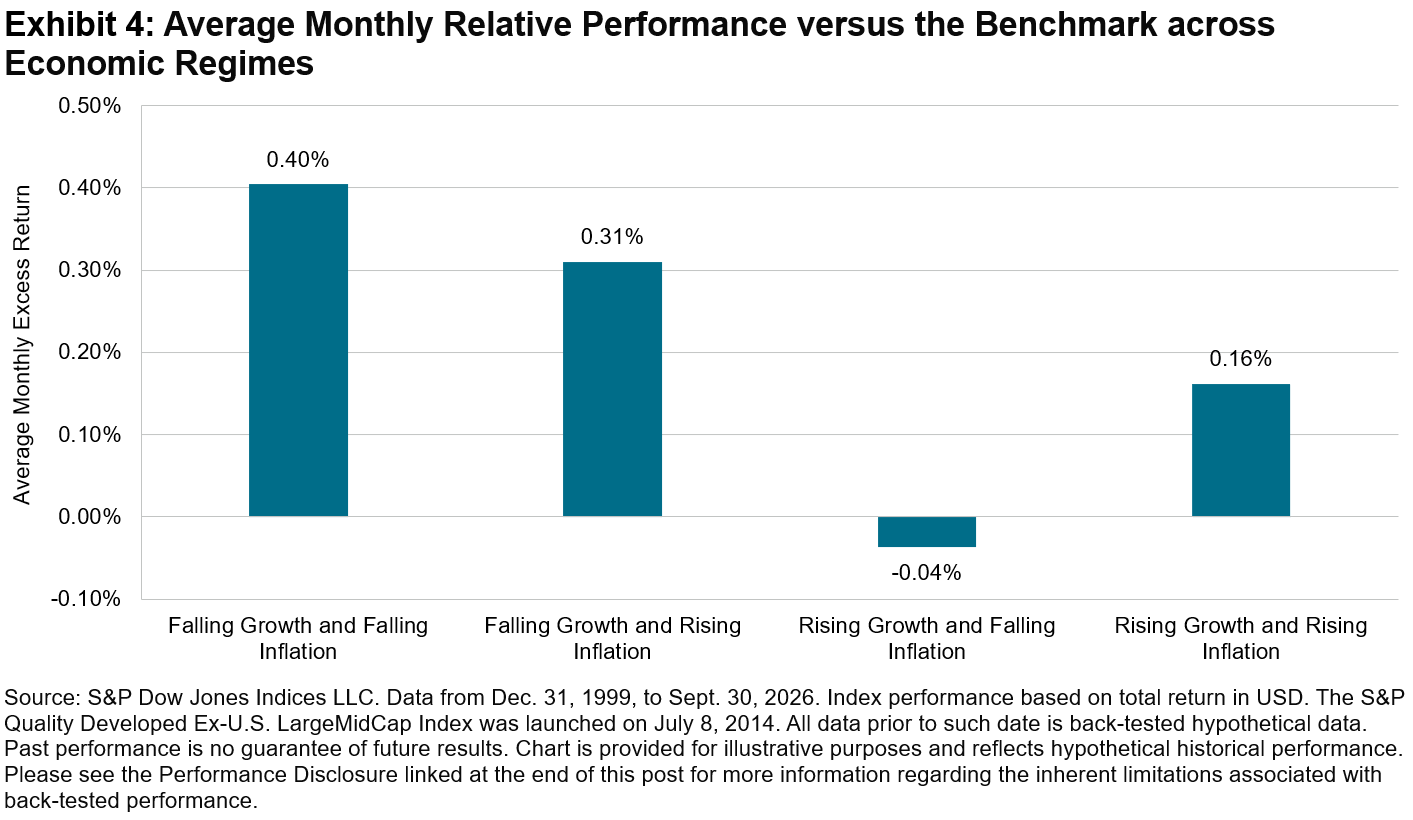
Exhibit 4 illustrates the index’s historical performance relative to its benchmark universe across four economic regimes, defined by rising or falling growth and inflation.2

Historically, the index has tended to outperform during periods of rising inflation, a regime that may be of particular relevance given the current market environment. This historical performance may reflect the structural resilience of companies with strong profitability, high earnings quality and robust balance sheets when inflationary pressures remain elevated.

A Large and Diverse Opportunity Set for Structural Diversification

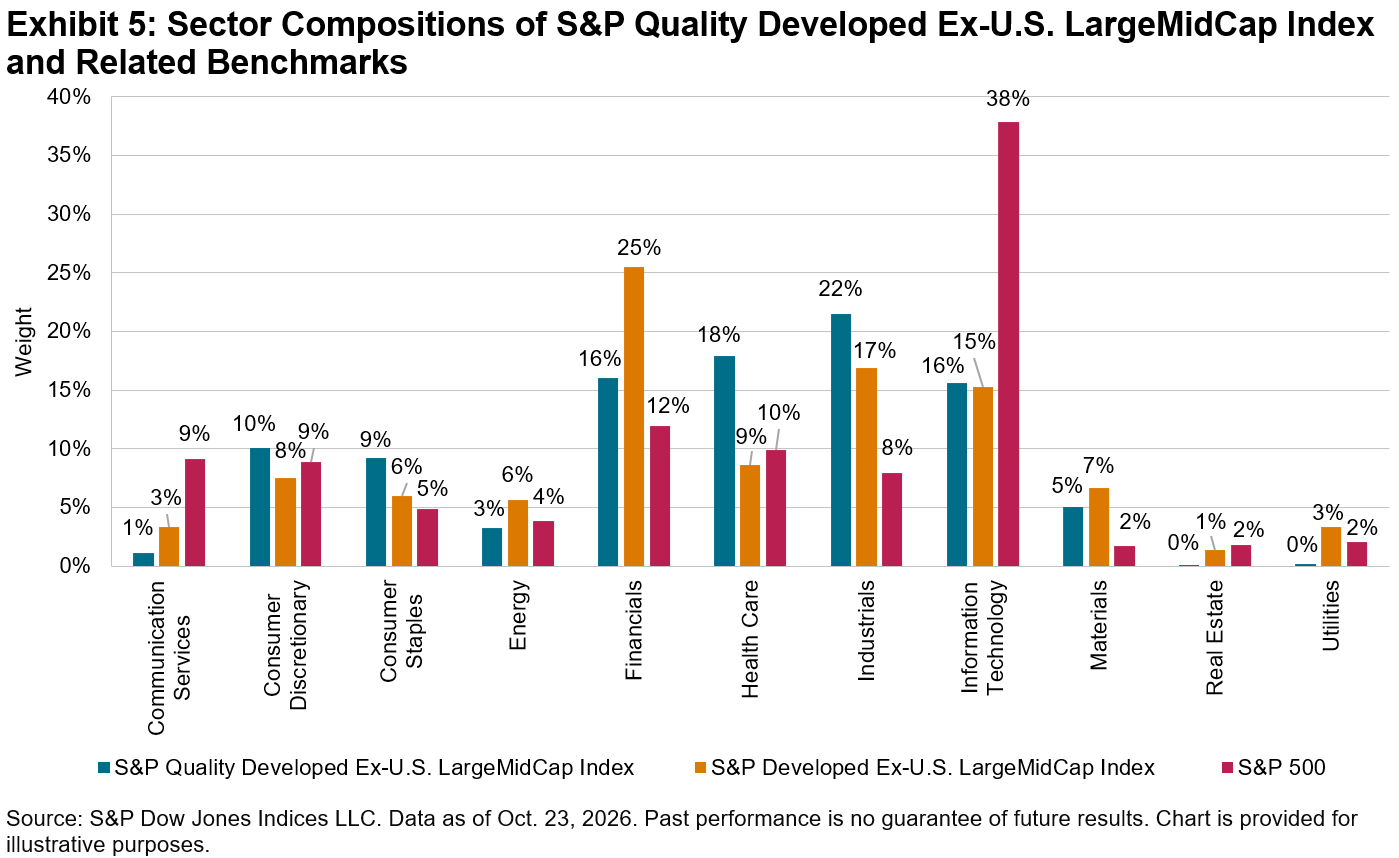
International equity markets reflect a broad range of geographies, economies and industries. The developed markets outside the U.S. represented in the S&P Quality Developed Ex-U.S. LargeMidCap Index have significant weight in Industrials, Health Care and Financials. This opportunity set differs meaningfully from the tech-heavy U.S. market.

Country Composition

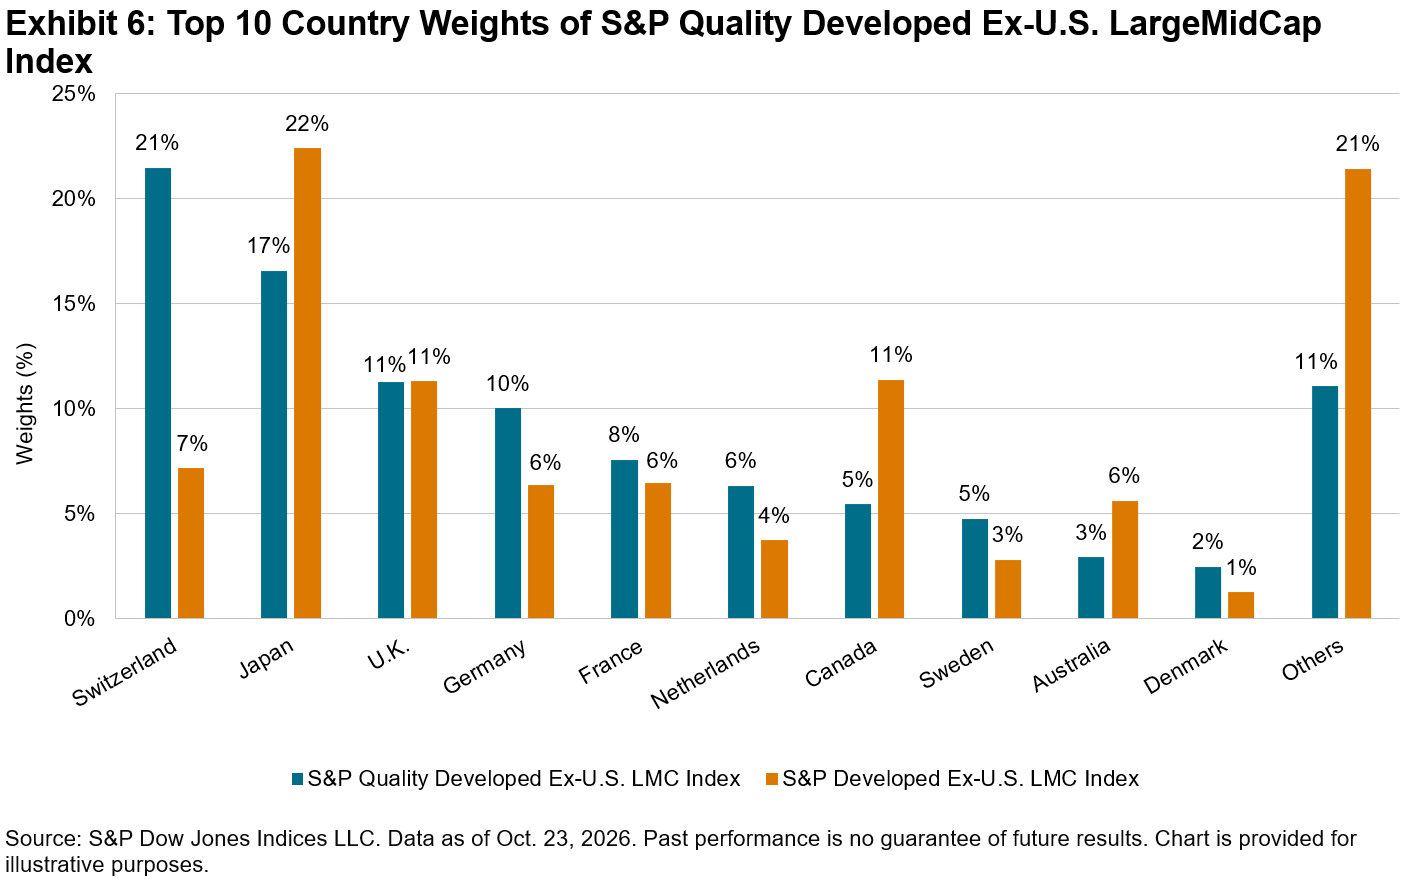
The S&P Quality Developed Ex-U.S. LargeMidCap Index has its largest absolute country weights in Switzerland, Japan, the U.K., Germany and France. Relative to its benchmark, the index is overweight in Switzerland, Germany and the Netherlands.

Conclusion

As global markets navigate elevated yields and persistent inflation, the S&P Quality Developed Ex-U.S. LargeMidCap Index may offer a lens for evaluating developed market equities outside the U.S. The index illustrates how companies with strong profitability, durable earnings and disciplined balance sheets have exhibited greater resilience across historic market cycles. This index offers a targeted lens for developed ex-U.S. equities and potential diversification characteristics worldwide.

1   For further information about the factor definition, factor score calculation and index design, please see the S&P Quality Indices Methodology.

2   Hao, Wenli Bill and Rupert Watts, “A Historical Perspective on Factor Index Performance across Macroeconomic Cycles,” S&P Dow Jones Indices LLC, August 2026.

The posts on this blog are opinions, not advice. Please read our Disclaimers.
Financial Viability: What Drives the S&P Pantera Digital Asset Index

Contributor Image
Felipe Diaz

Analyst, Global Exchanges & Digital Assets

S&P Dow Jones Indices

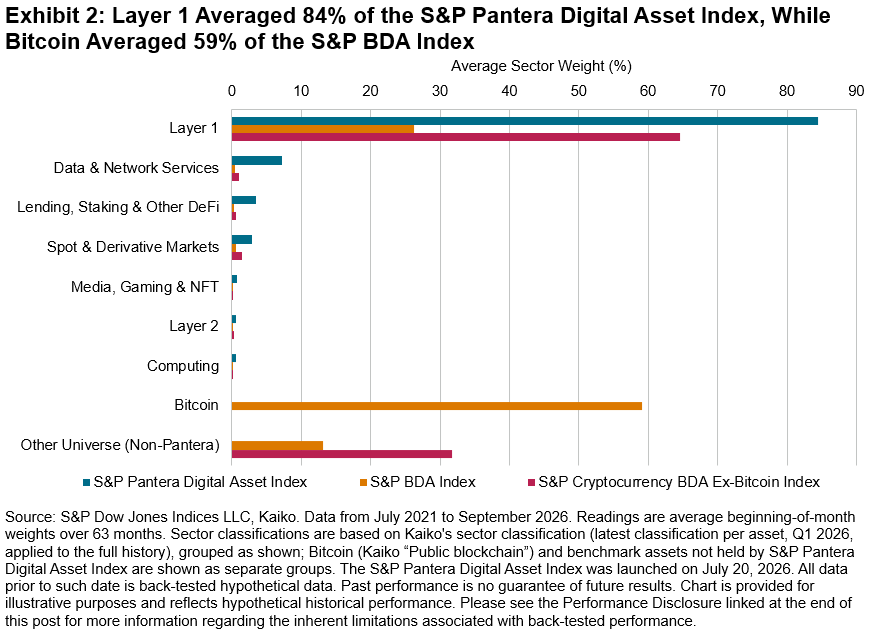
Broad digital asset benchmarks are generally dominated by a single asset. For example, Bitcoin’s weight in the S&P Cryptocurrency Broad Digital Asset (BDA) Index averaged 59% over the past five years. The S&P Pantera Digital Asset Index takes a different approach. Its composition is driven primarily by strict screening for financial viability, and it holds a concentrated basket of smart-contract platforms and exchange tokens with no Bitcoin exposure.

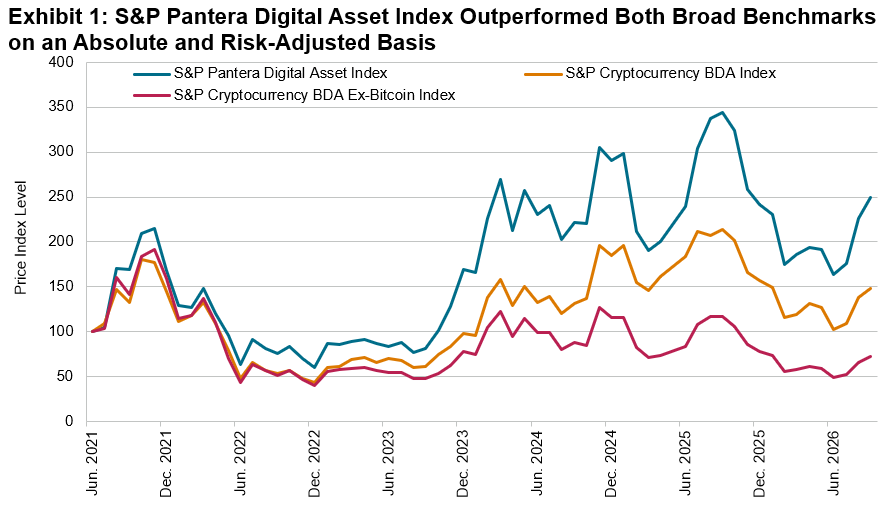
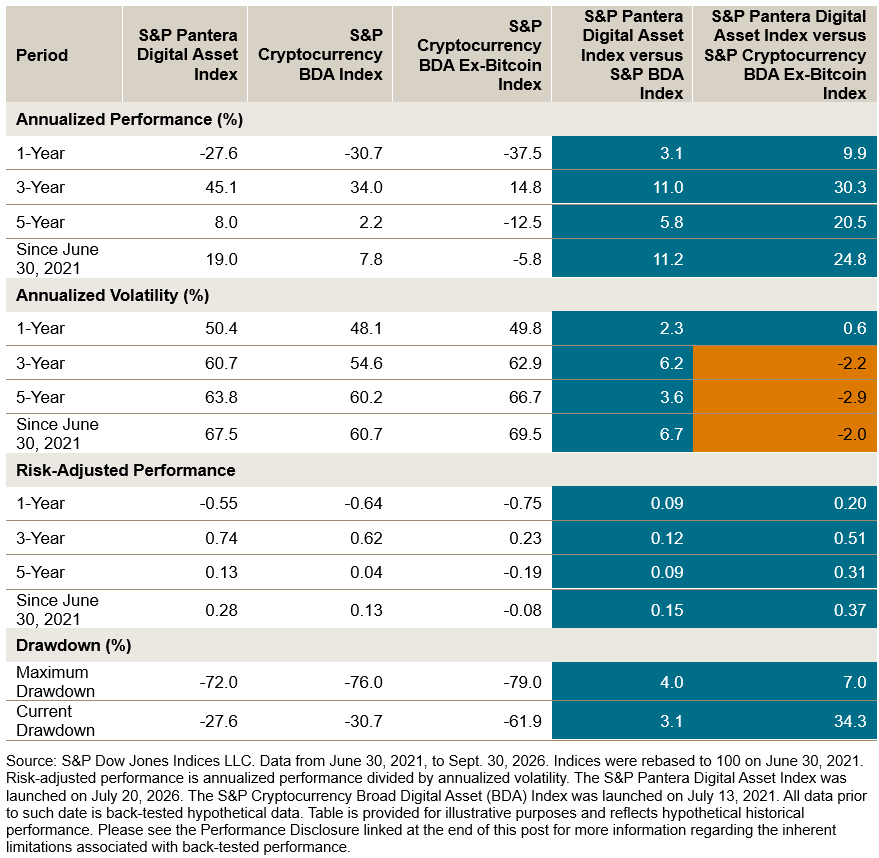
Over its full history, which is back-tested prior to the index’s July 20, 2026, launch, this design has translated into strong results. Since the start of the back-tested period on June 30, 2021, the S&P Pantera Digital Asset Index has gained 149.4%, or 19.0% annualized, compared with an annualized gain of 7.8% for the S&P Cryptocurrency BDA Index and an annualized loss of 5.8% for the S&P Cryptocurrency BDA Ex-Bitcoin Index. It did so with comparable annualized volatility (67% versus 61% and 69%, respectively) and a shallower maximum drawdown (-72.0% versus -76.0% and -79.0%, respectively). The result is a risk-adjusted performance of 0.28, more than double the S&P Cryptocurrency BDA Index’s 0.13 and well above the S&P Cryptocurrency BDA Ex-Bitcoin Index’s fall of 0.08.

Calendar-year results indicate that the outperformance seen in Exhibit 1 has not been uniform. The S&P Pantera Digital Asset Index outperformed the S&P Cryptocurrency BDA Index in four out of six years, led by 2023 (outperforming by 56.9 percentage points), and lagged most in 2024 (underperforming by 18.2 percentage points), when Bitcoin led the market. It outperformed the S&P Cryptocurrency BDA Ex-Bitcoin Index in all six years, indicating that its outperformance was not only due to the exclusion of Bitcoin.

The index’s composition helps explain the pattern seen in Exhibit 2. Layer 1 networks¹ averaged 84.5% of the S&P Pantera Digital Asset Index, 58.2 percentage points above the S&P Cryptocurrency BDA Index, while Data & Network Services averaged 7.2%. The index is also concentrated, with its top three holdings averaging 74.3% of its total weight.

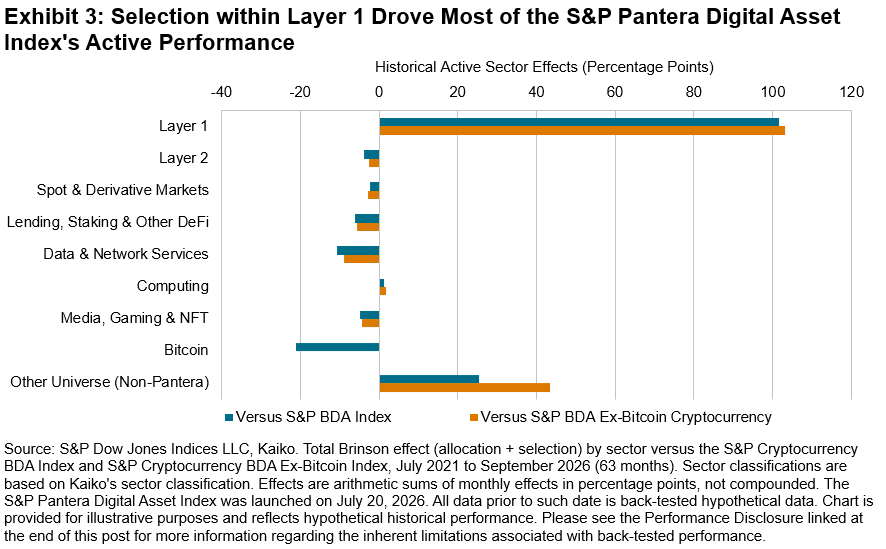
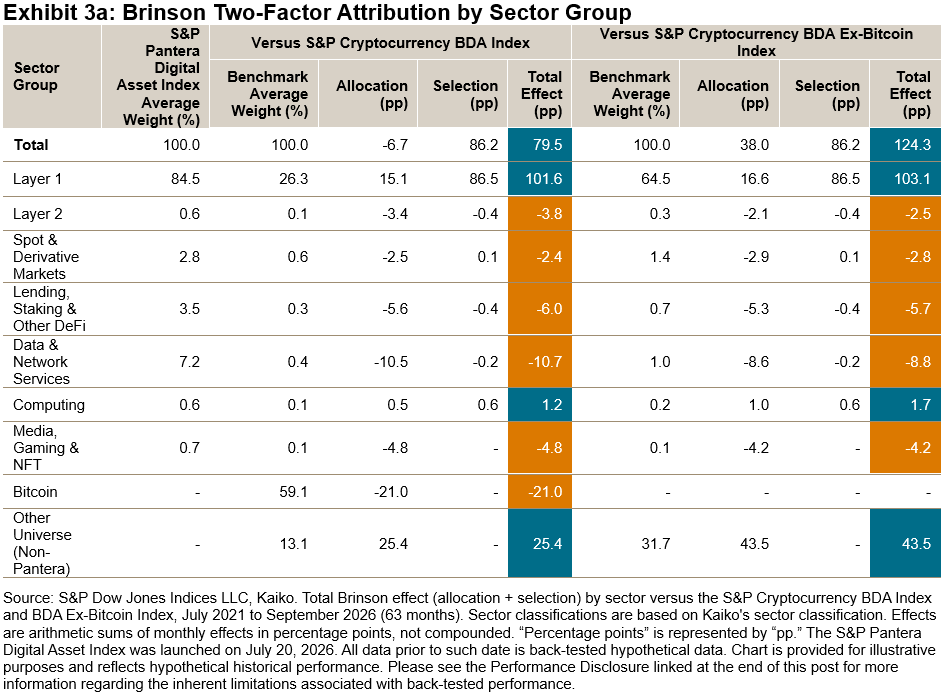
Attribution analysis indicates that sector allocation accounts for only part of the S&P Pantera Digital Asset Index’s performance. Monthly Brinson 2-Factor attribution against the S&P Cryptocurrency BDA Index yields 79.5 percentage points of cumulative active effect: -6.7 from allocation and 86.2 from selection. Selection within Layer 1 (86.5) drove most of it, meaning the S&P Pantera Digital Asset Index benefited from owning specific Layer 1 networks rather than the sector broadly. Within allocation, excluding Bitcoin cost the index 21.0 percentage points, while avoiding the long tail of smaller, speculative assets added 25.4 and the Layer 1 overweight added 15.1; overweights in the smaller non-Layer 1 sectors cost 26.3 (led by Data & Network Services, -10.5).

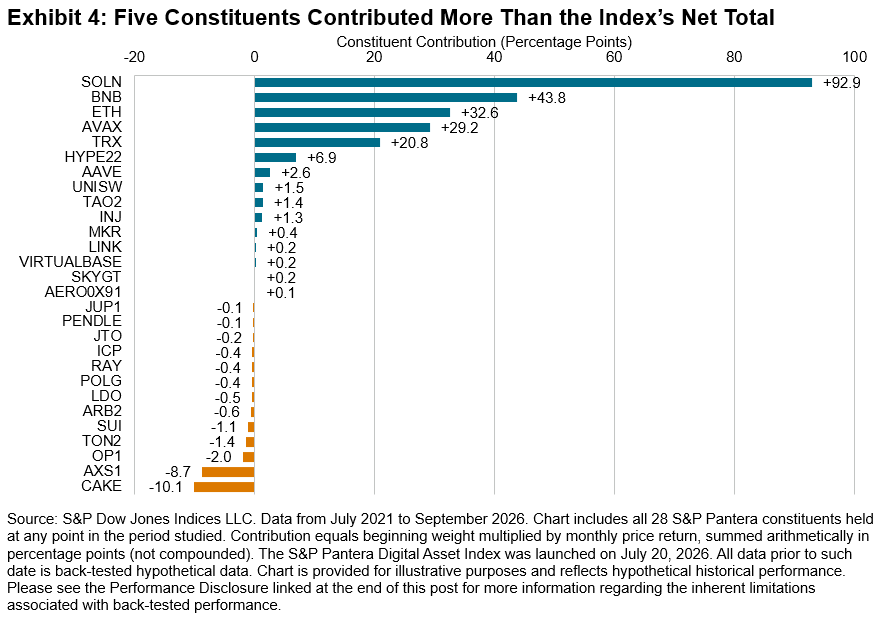
Constituent-level contributions are consistent with the findings in Exhibit 4: gains were concentrated in a handful of Layer 1 networks, while losses were contained. Solana (up 92.9 percentage points), BNB (up 43.8), Ether (up 32.6), Avalanche (up 29.2) and TRON (up 20.8) together contributed 219.3 percentage points, more than the 208.2 percentage points contributed by all 28 constituents combined. The 13 detractors cost 25.9 percentage points in total, and 11 of them cost less than 2 points each. Severe losses were also rarer: 7% of S&P Pantera Digital Asset Index constituents fell 90% or more while held, versus 19% for the S&P Cryptocurrency BDA Index, suggesting that the index’s financial viability screening may help avoid tokens that are more likely to experience dramatic declines in value.

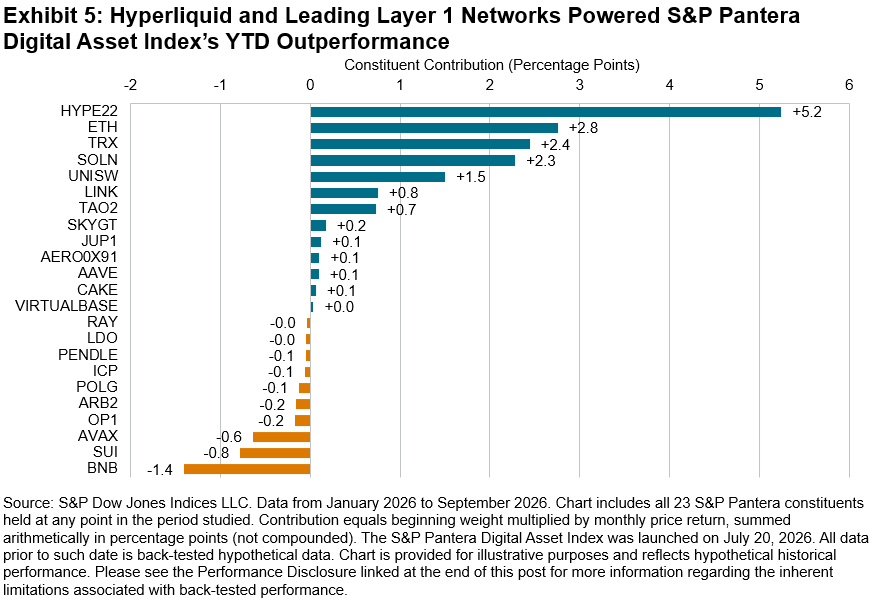
Year-to-date results tell a similar story. Through September, the S&P Pantera Digital Asset Index gained 3.0%, versus a loss of 5.4% for the S&P Cryptocurrency BDA Index and a loss of 7.1% for the S&P Cryptocurrency BDA Ex-Bitcoin Index. Not holding Bitcoin cost only 0.6 percentage points; the lead came from what the index did include. Four constituents contributed 12.7 of the 12.8 percentage points total, led by Hyperliquid (up 5.2), a DeFi asset rather than a Layer 1.

Conclusion

Overall, the S&P Pantera Digital Asset Index’s back-tested results seem to trace back to its financial viability screen. By focusing on assets that generate economic activity, the screen tended to tilt the index toward smart-contract platforms and exchange tokens, so its infrastructure overweight reflects where that activity sits within the asset class rather than a standalone sector bet. Including the strongest of those networks while avoiding the speculative long tail drove most of the outperformance, while excluding Bitcoin remained the main trade-off, as 2024 showed.


1 Kaiko’s sector classification assigns each digital asset to a sector based on its primary use case and is published quarterly; this analysis uses Kaiko’s quarterly history (Q1 2020-Q1 2026) and applies each asset’s latest classification to the full history. Kaiko sectors are grouped for presentation (e.g., Staking, Decentralized Lending, Investment and Prediction Market as “Lending, Staking & Other DeFi”; Network, Data Service, Certification & Identity, Cross-chain Interoperability, Governance tools and Business Services as “Data & Network Services”; Media Service, NFT, Gaming and Social network & Messaging as “Media, Gaming & NFT”). Toncoin is mapped manually to Kaiko’s “ton” code.

The posts on this blog are opinions, not advice. Please read our Disclaimers.