




Get Indexology® Blog updates via email.

In This List

Taking the Pulse: What Private Wealth Managers Are Saying in the S&P DJI Market Sentiment Survey for Wealth Indices (Q3 2026)

Quality and Diversification across Developed Markets outside the U.S.

Financial Viability: What Drives the S&P Pantera Digital Asset Index

AI Anxiety or Opportunity?

The Real Deal

Taking the Pulse: What Private Wealth Managers Are Saying in the S&P DJI Market Sentiment Survey for Wealth Indices (Q3 2026)

Contributor Image
Daniel Hurdley

Managing Director, ARC Research

S&P Dow Jones Indices

Private wealth managers sit at the intersection of market narratives and real-world client implementation. Their views can offer insight into how risk appetite and portfolio preferences are evolving, particularly when measured consistently over time.

In the latest S&P DJI Market Sentiment Survey for Wealth Indices (64th edition), 55 firms shared their 12-month outlook across major asset classes and other portfolio positioning questions. In this blog, we highlight a few headline takeaways and one notable deeper theme on domestic equity exposure that continues to develop.

Asset Class Sentiment—Equities Still Lead, Bonds Remain Out of Favor

At the headline level, equities remain the clear favorite, with alternatives also strongly supported. Bonds continue to be the least favored asset class, while cash sentiment is mixed (notably with a meaningful neutral camp).
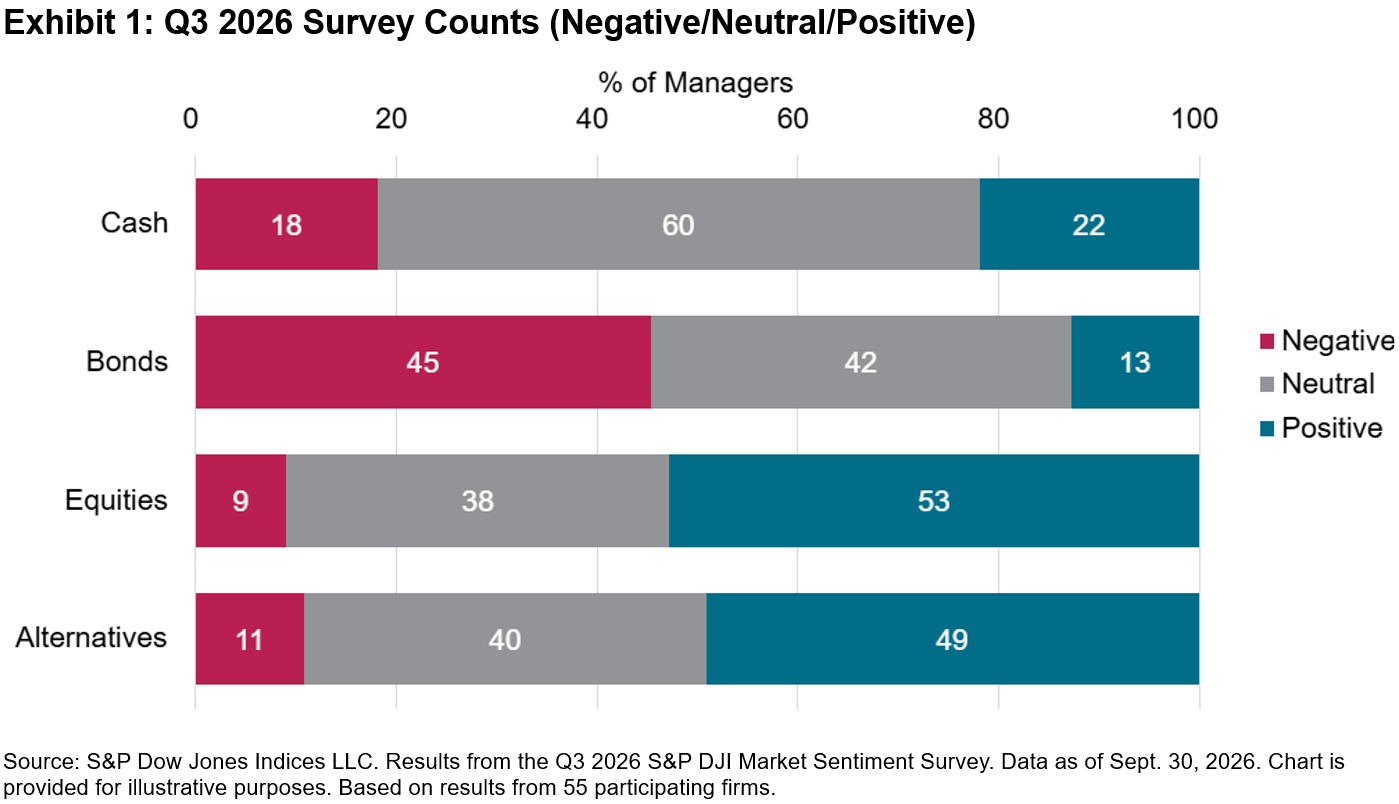
Overall, this keeps the story consistent with recent quarters: managers appear willing to take risk primarily via public equities and liquid diversifiers, while remaining cautious on “traditional” fixed income at the broad asset class level.

Beneath the Headline: Domestic Equity Exposure Remains Structurally Low

This quarter, we revisited a question we last asked in 2024 regarding four risk profiles: Cautious, Balanced Asset, Steady Growth and Equity Risk:

At a Strategic Asset Allocation level, what is the approximate domestic equity exposure (as a proportion of overall equity exposure) for each of the four risk profiles?
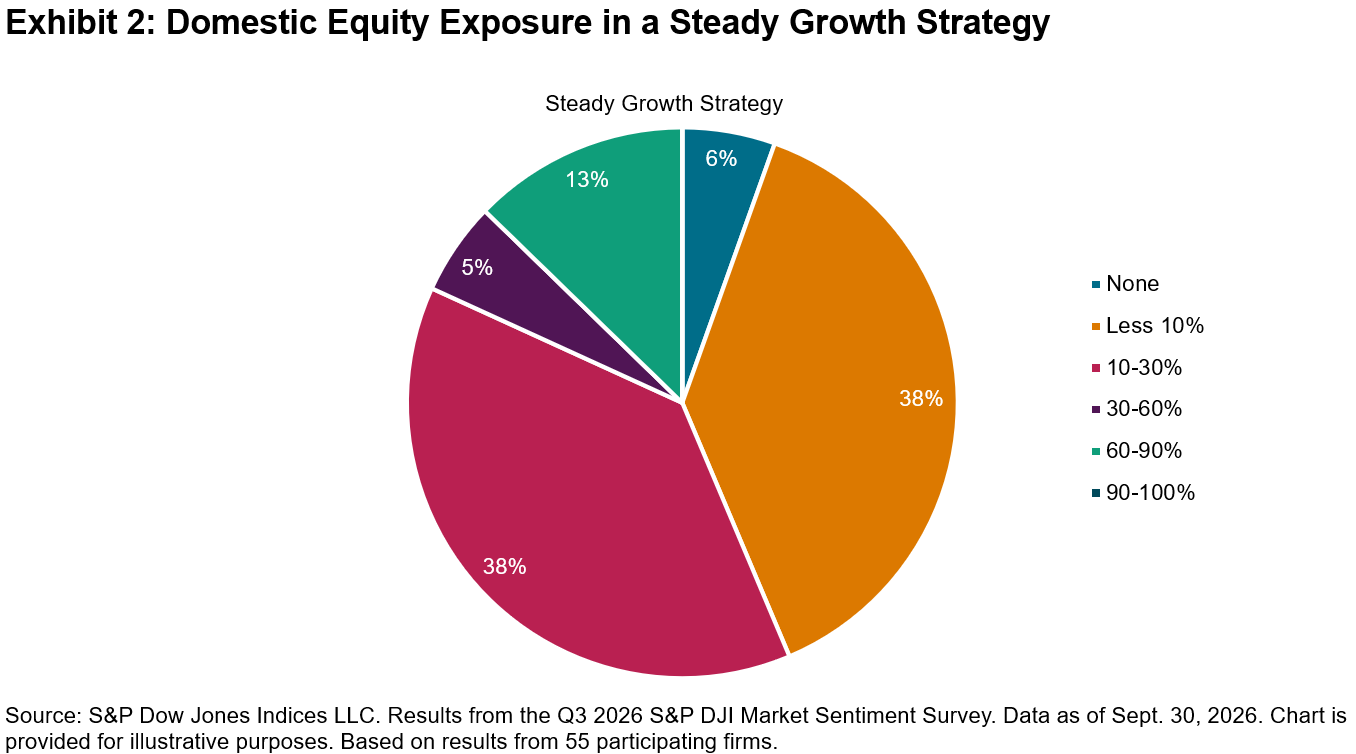
For Steady Growth mandates, the message is consistent and fairly structural: domestic equity exposure is typically a minority share of overall equity exposure.

Key Takeaways

  • The “below 30%” outcome dominates: In Q3 2026, 82% of Steady Growth portfolios held less than 30% domestic equity exposure (as a share of overall equity exposure).
  • A continued shift toward the very low end: Within that sub-30% bucket, “less than 10%” allocations have become more prevalent, and the split between “less than 10%” and “10-30%” is now almost equal, pointing to a further retreat from moderate domestic allocations versus 2024.
  • Five-year direction of travel supports diversification: Across the broader five-year view, managers are still more likely to report reducing domestic exposure than increasing it, reinforcing the same diversification narrative that shows up in Steady Growth mandates now.

How to Access the Full Report

The full survey includes the additional detail behind these headlines; full breakdowns across regions, sectors and currencies; plus conviction shifts versus prior periods. As with prior quarters, access to the full report is reserved for investment managers who complete the survey. Find out more on our website.

This content may be AI-assisted and is composed, reviewed, edited, and approved by S&P Global.

The posts on this blog are opinions, not advice. Please read our Disclaimers.

Quality and Diversification across Developed Markets outside the U.S.

Contributor Image
Wenli Bill Hao

Director, Factors and Dividends Indices, Product Management and Development

S&P Dow Jones Indices

Sovereign bond yields have climbed to their highest levels in a decade across several major international markets, driven by elevated global energy prices and persistent inflation. As higher risk-free rates can weigh on equity valuations and raise the cost of capital, market participants may place greater emphasis on companies with strong profitability, higher-quality earnings and sound balance sheets.

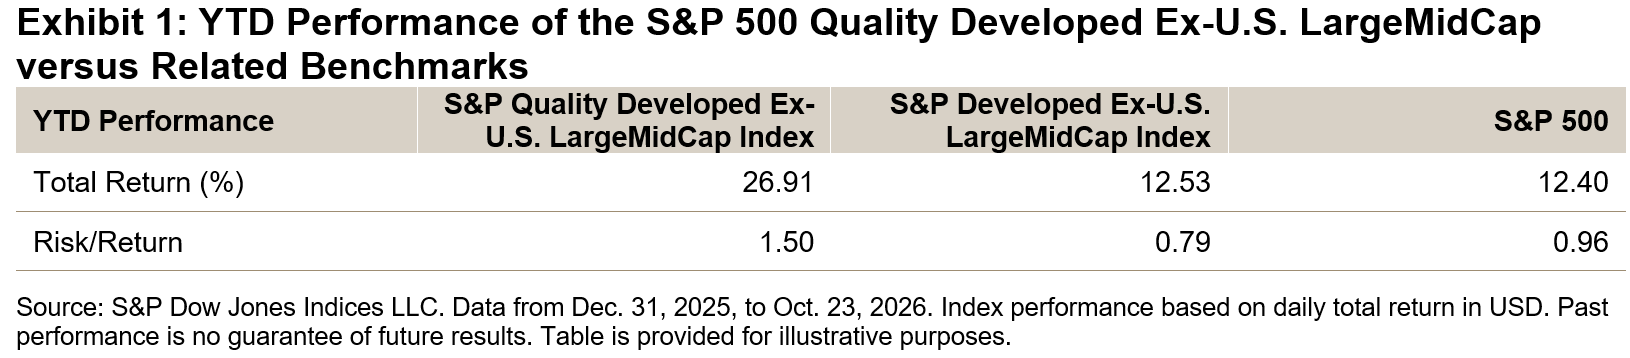
Against this backdrop, the S&P Quality Developed Ex-U.S. LargeMidCap Index has outperformed its benchmark YTD through Oct. 23, 2026.

Performance

As shown in Exhibit 1, the S&P Quality Developed Ex-U.S. LargeMidCap Index outperformed its underlying benchmark by about 14% YTD. This result is consistent with the index’s longer-term track record and highlights the historical performance characteristics of a quality-focused strategy. The index also outperformed the broad U.S. equity market, as represented by the S&P 500®.

Methodology Overview

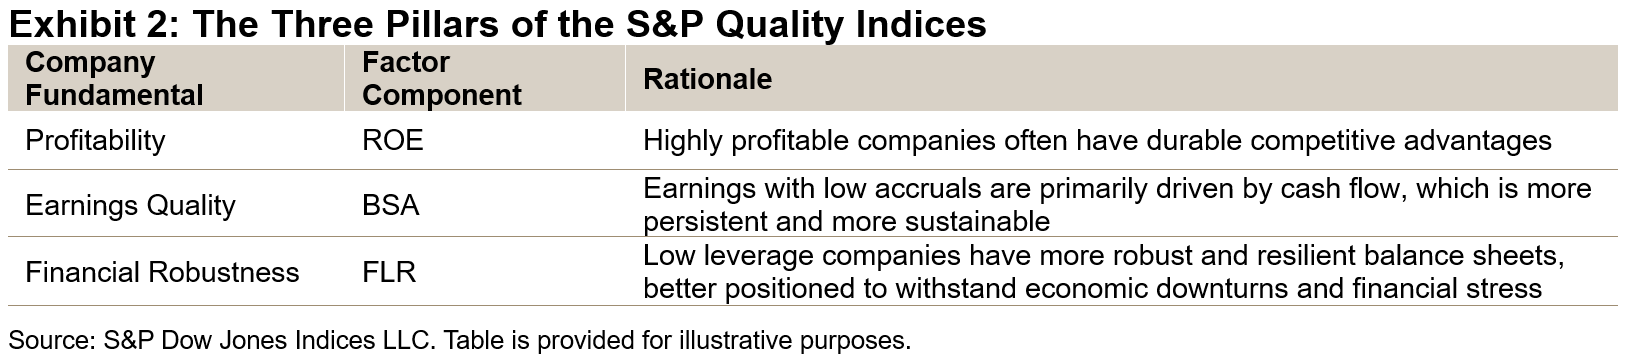
Higher quality companies may exhibit strong and stable profitability, sustained earnings growth, robust cash flows and prudent capital structures. The S&P Quality Indices assess these characteristics using three key metrics, shown in Exhibit 2: return on equity (ROE), the balance sheet accruals ratio (BSA) and the financial leverage ratio (FLR). Each metric offers a distinct perspective on a company’s overall quality.

The S&P Quality Developed Ex-U.S. LargeMidCap Index measures the performance of high-quality companies across developed markets outside the U.S. Its selection process identifies the top 20% of eligible stocks based on their quality scores. Constituents are then weighed by the product of their float market capitalization and quality scores, subject to constraints.1

Long-Term Outperformance

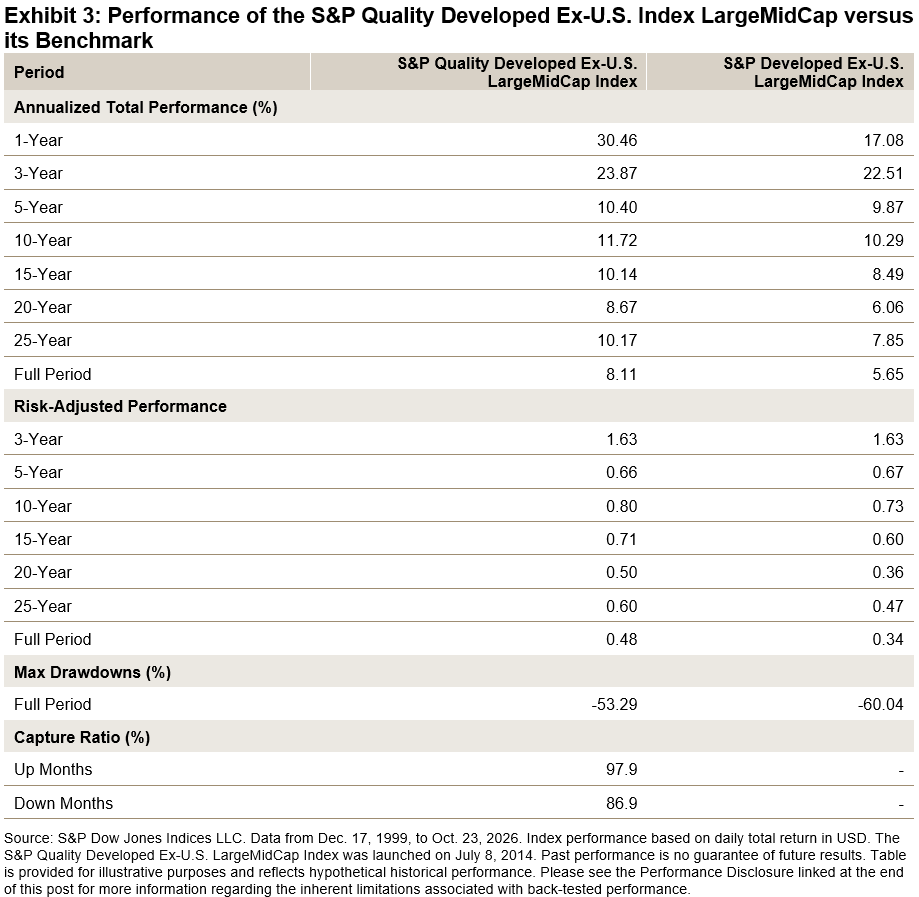
Across both short- and long-term horizons, the S&P Quality Developed Ex-U.S. LargeMidCap Index has outperformed its benchmark. The index has also historically exhibited defensive characteristics, including lower drawdowns and lower downside capture.

Performance across Economic Cycles

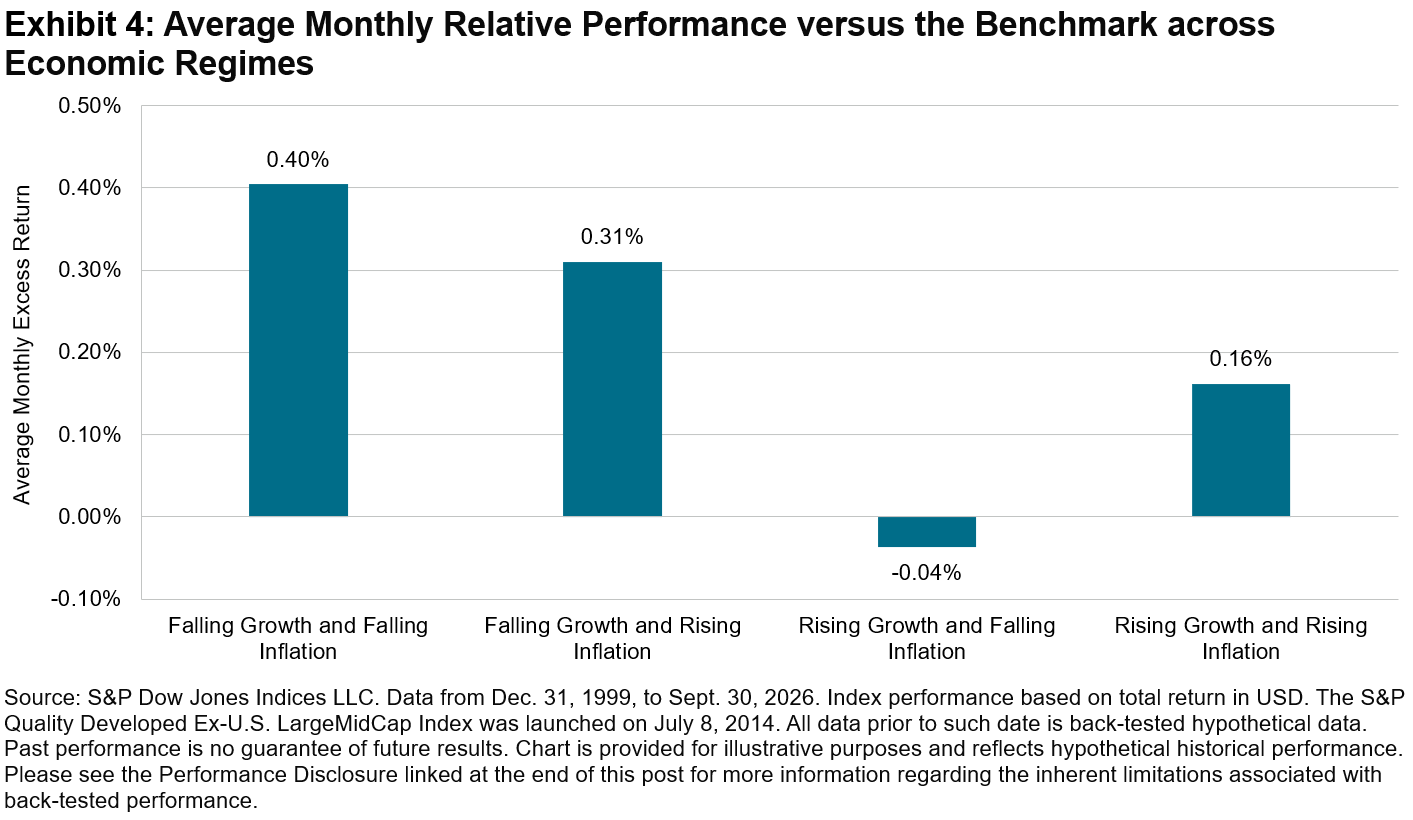
Exhibit 4 illustrates the index’s historical performance relative to its benchmark universe across four economic regimes, defined by rising or falling growth and inflation.2

Historically, the index has tended to outperform during periods of rising inflation, a regime that may be of particular relevance given the current market environment. This historical performance may reflect the structural resilience of companies with strong profitability, high earnings quality and robust balance sheets when inflationary pressures remain elevated.

A Large and Diverse Opportunity Set for Structural Diversification

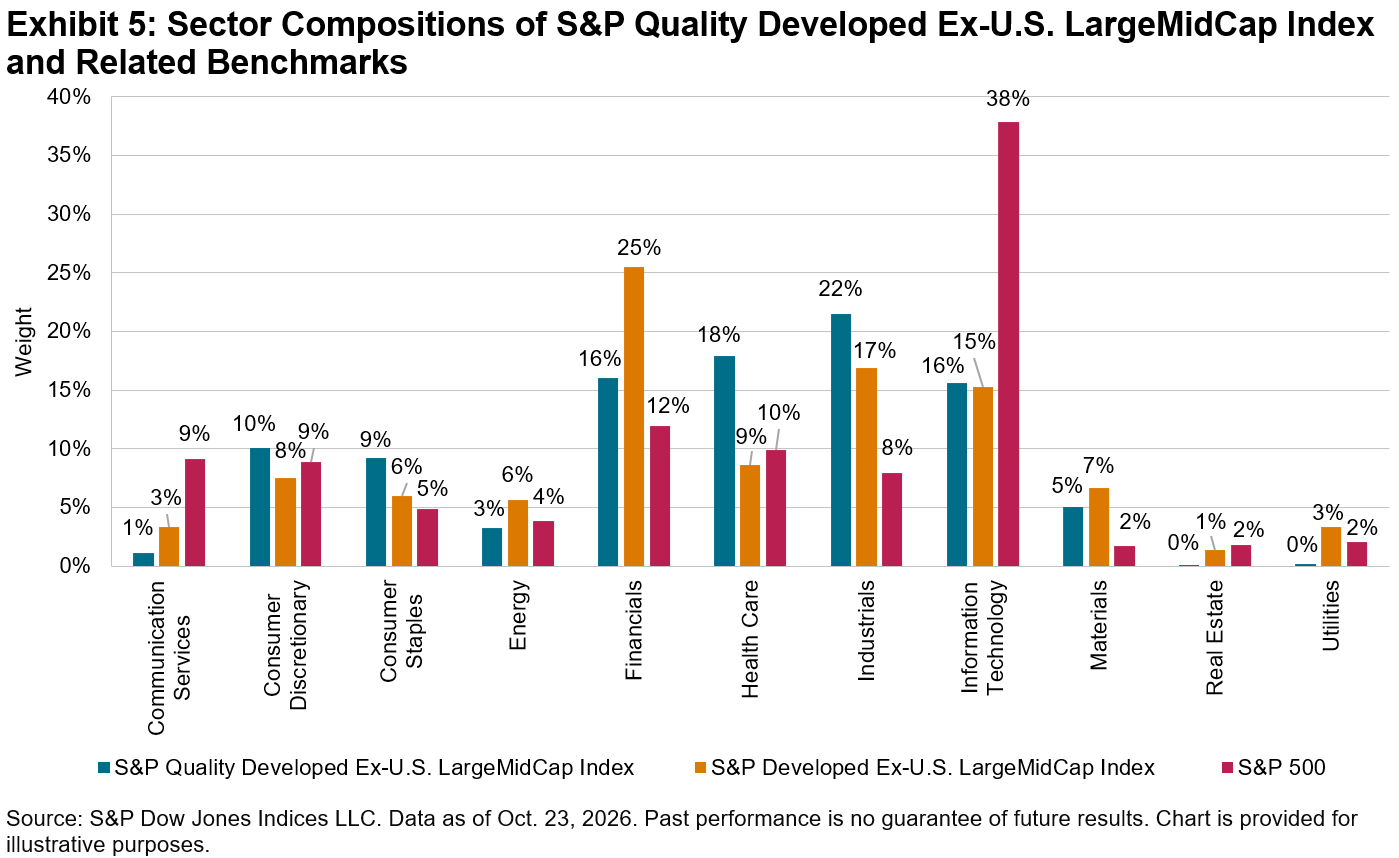
International equity markets reflect a broad range of geographies, economies and industries. The developed markets outside the U.S. represented in the S&P Quality Developed Ex-U.S. LargeMidCap Index have significant weight in Industrials, Health Care and Financials. This opportunity set differs meaningfully from the tech-heavy U.S. market.

Country Composition

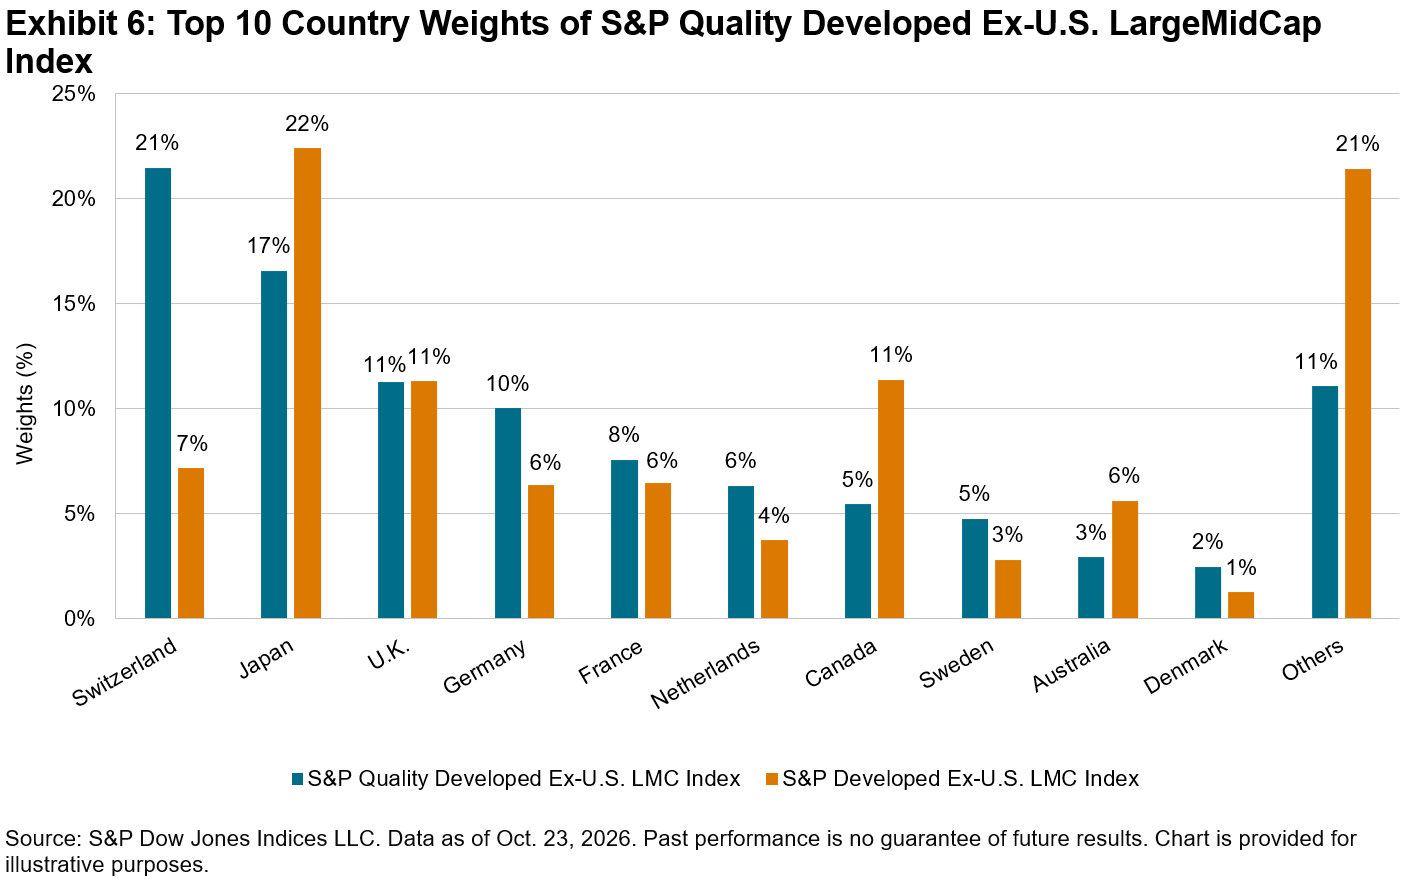
The S&P Quality Developed Ex-U.S. LargeMidCap Index has its largest absolute country weights in Switzerland, Japan, the U.K., Germany and France. Relative to its benchmark, the index is overweight in Switzerland, Germany and the Netherlands.

Conclusion

As global markets navigate elevated yields and persistent inflation, the S&P Quality Developed Ex-U.S. LargeMidCap Index may offer a lens for evaluating developed market equities outside the U.S. The index illustrates how companies with strong profitability, durable earnings and disciplined balance sheets have exhibited greater resilience across historic market cycles. This index offers a targeted lens for developed ex-U.S. equities and potential diversification characteristics worldwide.

1   For further information about the factor definition, factor score calculation and index design, please see the S&P Quality Indices Methodology.

2   Hao, Wenli Bill and Rupert Watts, “A Historical Perspective on Factor Index Performance across Macroeconomic Cycles,” S&P Dow Jones Indices LLC, August 2026.

The posts on this blog are opinions, not advice. Please read our Disclaimers.

Financial Viability: What Drives the S&P Pantera Digital Asset Index

Contributor Image
Felipe Diaz

Analyst, Global Exchanges & Digital Assets

S&P Dow Jones Indices

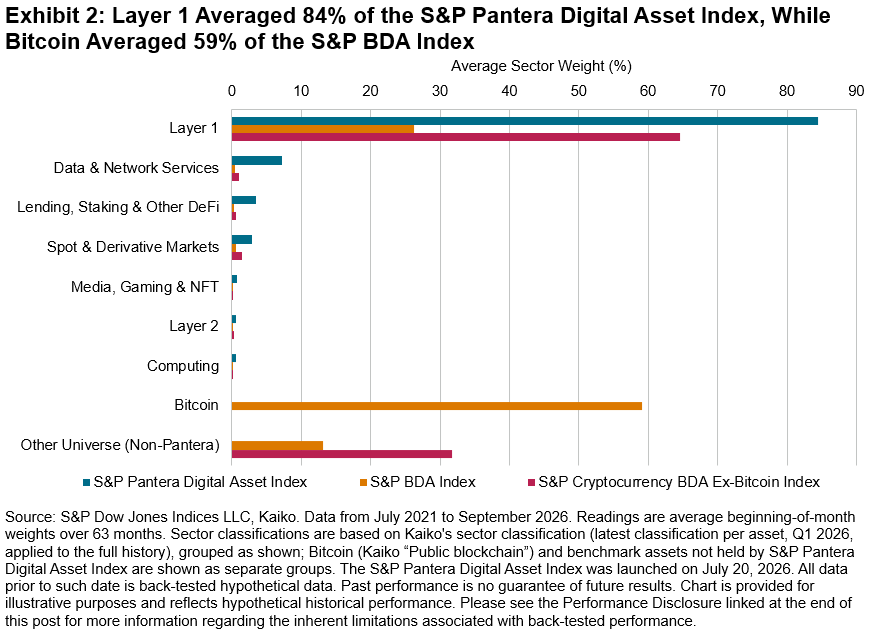
Broad digital asset benchmarks are generally dominated by a single asset. For example, Bitcoin’s weight in the S&P Cryptocurrency Broad Digital Asset (BDA) Index averaged 59% over the past five years. The S&P Pantera Digital Asset Index takes a different approach. Its composition is driven primarily by strict screening for financial viability, and it holds a concentrated basket of smart-contract platforms and exchange tokens with no Bitcoin exposure.

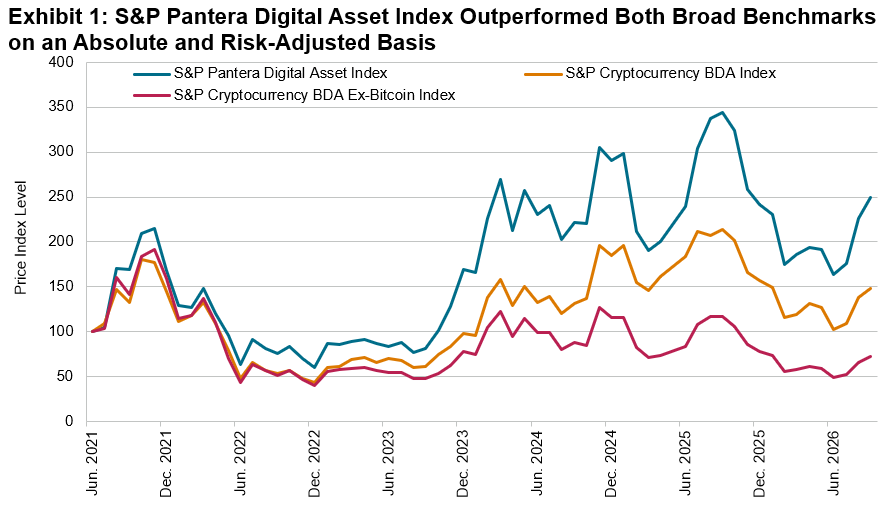
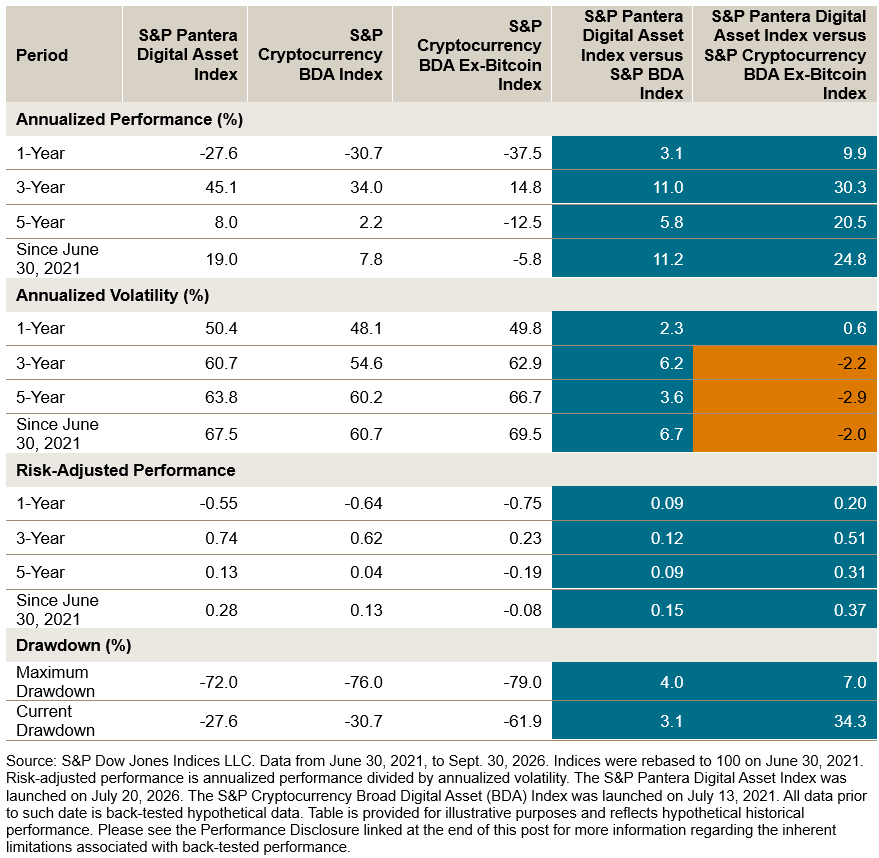
Over its full history, which is back-tested prior to the index’s July 20, 2026, launch, this design has translated into strong results. Since the start of the back-tested period on June 30, 2021, the S&P Pantera Digital Asset Index has gained 149.4%, or 19.0% annualized, compared with an annualized gain of 7.8% for the S&P Cryptocurrency BDA Index and an annualized loss of 5.8% for the S&P Cryptocurrency BDA Ex-Bitcoin Index. It did so with comparable annualized volatility (67% versus 61% and 69%, respectively) and a shallower maximum drawdown (-72.0% versus -76.0% and -79.0%, respectively). The result is a risk-adjusted performance of 0.28, more than double the S&P Cryptocurrency BDA Index’s 0.13 and well above the S&P Cryptocurrency BDA Ex-Bitcoin Index’s fall of 0.08.

Calendar-year results indicate that the outperformance seen in Exhibit 1 has not been uniform. The S&P Pantera Digital Asset Index outperformed the S&P Cryptocurrency BDA Index in four out of six years, led by 2023 (outperforming by 56.9 percentage points), and lagged most in 2024 (underperforming by 18.2 percentage points), when Bitcoin led the market. It outperformed the S&P Cryptocurrency BDA Ex-Bitcoin Index in all six years, indicating that its outperformance was not only due to the exclusion of Bitcoin.

The index’s composition helps explain the pattern seen in Exhibit 2. Layer 1 networks¹ averaged 84.5% of the S&P Pantera Digital Asset Index, 58.2 percentage points above the S&P Cryptocurrency BDA Index, while Data & Network Services averaged 7.2%. The index is also concentrated, with its top three holdings averaging 74.3% of its total weight.

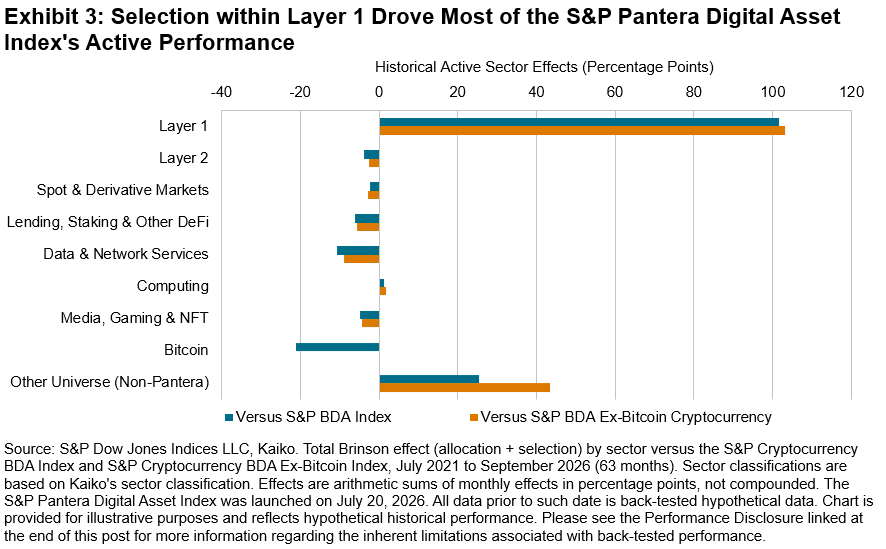
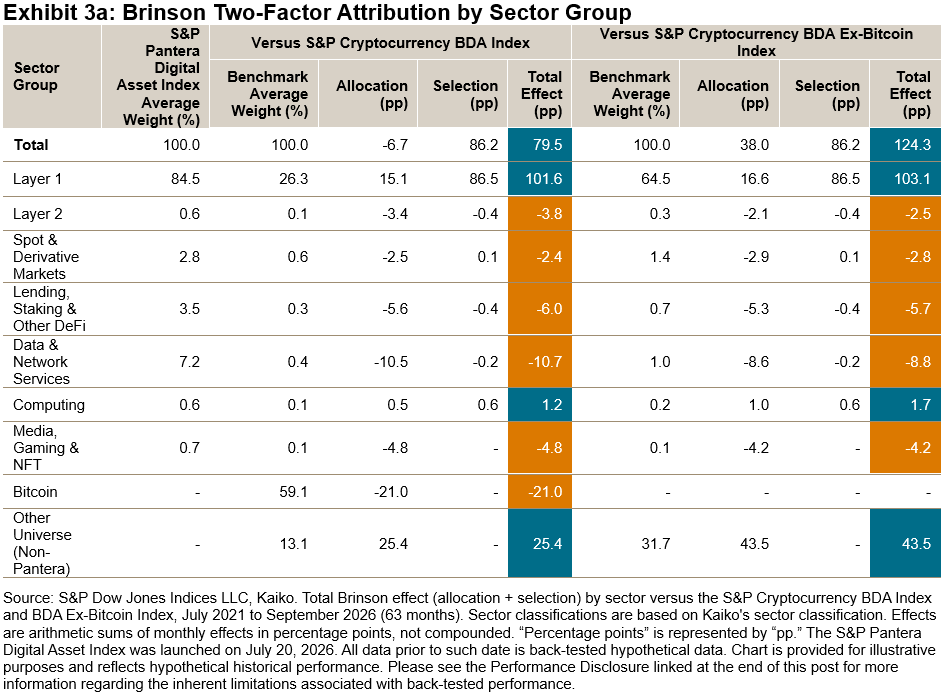
Attribution analysis indicates that sector allocation accounts for only part of the S&P Pantera Digital Asset Index’s performance. Monthly Brinson 2-Factor attribution against the S&P Cryptocurrency BDA Index yields 79.5 percentage points of cumulative active effect: -6.7 from allocation and 86.2 from selection. Selection within Layer 1 (86.5) drove most of it, meaning the S&P Pantera Digital Asset Index benefited from owning specific Layer 1 networks rather than the sector broadly. Within allocation, excluding Bitcoin cost the index 21.0 percentage points, while avoiding the long tail of smaller, speculative assets added 25.4 and the Layer 1 overweight added 15.1; overweights in the smaller non-Layer 1 sectors cost 26.3 (led by Data & Network Services, -10.5).

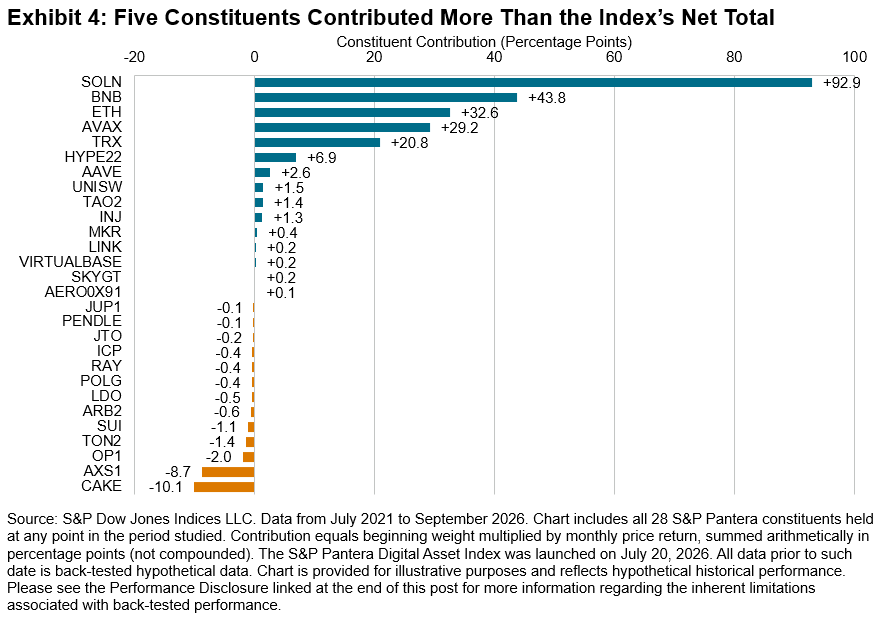
Constituent-level contributions are consistent with the findings in Exhibit 4: gains were concentrated in a handful of Layer 1 networks, while losses were contained. Solana (up 92.9 percentage points), BNB (up 43.8), Ether (up 32.6), Avalanche (up 29.2) and TRON (up 20.8) together contributed 219.3 percentage points, more than the 208.2 percentage points contributed by all 28 constituents combined. The 13 detractors cost 25.9 percentage points in total, and 11 of them cost less than 2 points each. Severe losses were also rarer: 7% of S&P Pantera Digital Asset Index constituents fell 90% or more while held, versus 19% for the S&P Cryptocurrency BDA Index, suggesting that the index’s financial viability screening may help avoid tokens that are more likely to experience dramatic declines in value.

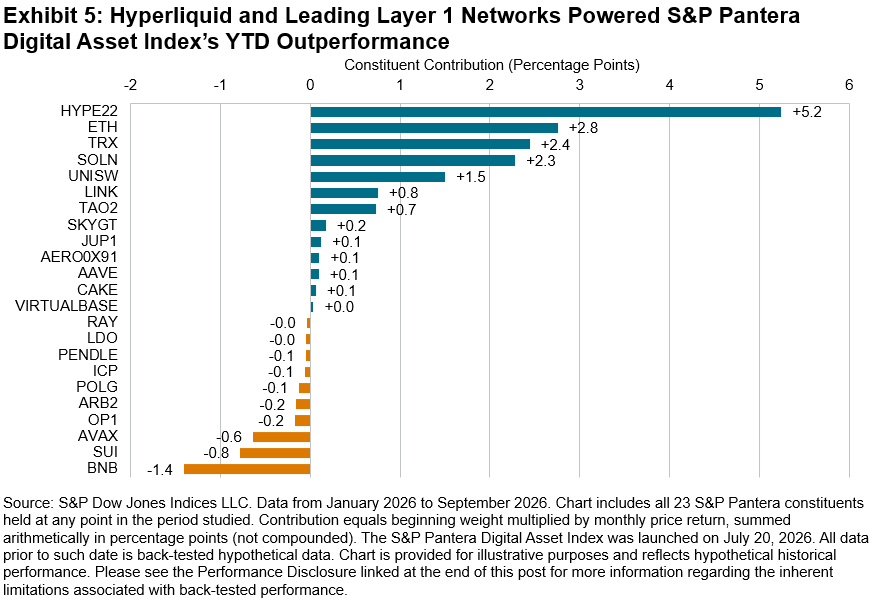
Year-to-date results tell a similar story. Through September, the S&P Pantera Digital Asset Index gained 3.0%, versus a loss of 5.4% for the S&P Cryptocurrency BDA Index and a loss of 7.1% for the S&P Cryptocurrency BDA Ex-Bitcoin Index. Not holding Bitcoin cost only 0.6 percentage points; the lead came from what the index did include. Four constituents contributed 12.7 of the 12.8 percentage points total, led by Hyperliquid (up 5.2), a DeFi asset rather than a Layer 1.

Conclusion

Overall, the S&P Pantera Digital Asset Index’s back-tested results seem to trace back to its financial viability screen. By focusing on assets that generate economic activity, the screen tended to tilt the index toward smart-contract platforms and exchange tokens, so its infrastructure overweight reflects where that activity sits within the asset class rather than a standalone sector bet. Including the strongest of those networks while avoiding the speculative long tail drove most of the outperformance, while excluding Bitcoin remained the main trade-off, as 2024 showed.


1 Kaiko’s sector classification assigns each digital asset to a sector based on its primary use case and is published quarterly; this analysis uses Kaiko’s quarterly history (Q1 2020-Q1 2026) and applies each asset’s latest classification to the full history. Kaiko sectors are grouped for presentation (e.g., Staking, Decentralized Lending, Investment and Prediction Market as “Lending, Staking & Other DeFi”; Network, Data Service, Certification & Identity, Cross-chain Interoperability, Governance tools and Business Services as “Data & Network Services”; Media Service, NFT, Gaming and Social network & Messaging as “Media, Gaming & NFT”). Toncoin is mapped manually to Kaiko’s “ton” code.

The posts on this blog are opinions, not advice. Please read our Disclaimers.

AI Anxiety or Opportunity?

Contributor Image
Anu Ganti

Head of U.S. Index Investment Strategy

S&P Dow Jones Indices

U.S. equity markets have been volatile recently, driven by a sharp sell-off in tech stocks, followed by a rebound, as investors struggle to assess the sustainability of the AI trade, with the S&P 500® up 1% month-to-date.1 Anthropic’s public IPO filing makes the question especially timely: is the market’s long-standing reliance on AI-related optimism a cause for anxiety or an opportunity for investors?

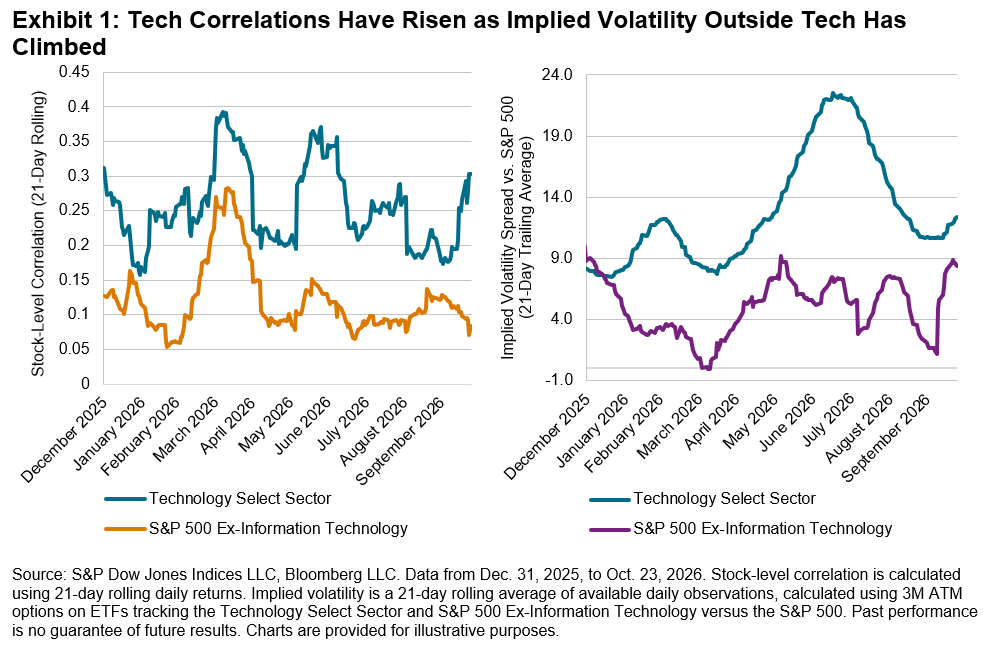
As fears have grown over the impact of AI capex on corporate balance sheets, Exhibit 1 shows that stock-level correlations have risen for the Technology Select Sector and declined for the S&P 500 Ex-Information Technology since the end of Q3, suggesting the rest of the market has been relatively immune so far.

Yet forward-looking measures suggest investors may not be convinced that the rest of the market can stay insulated. The implied volatility for the S&P 500 Ex-Information Technology relative to the S&P 500 has been rising, narrowing its gap with the Technology Select Sector, which may signal that the equity market sees the risks of AI spreading beyond the tech sector.

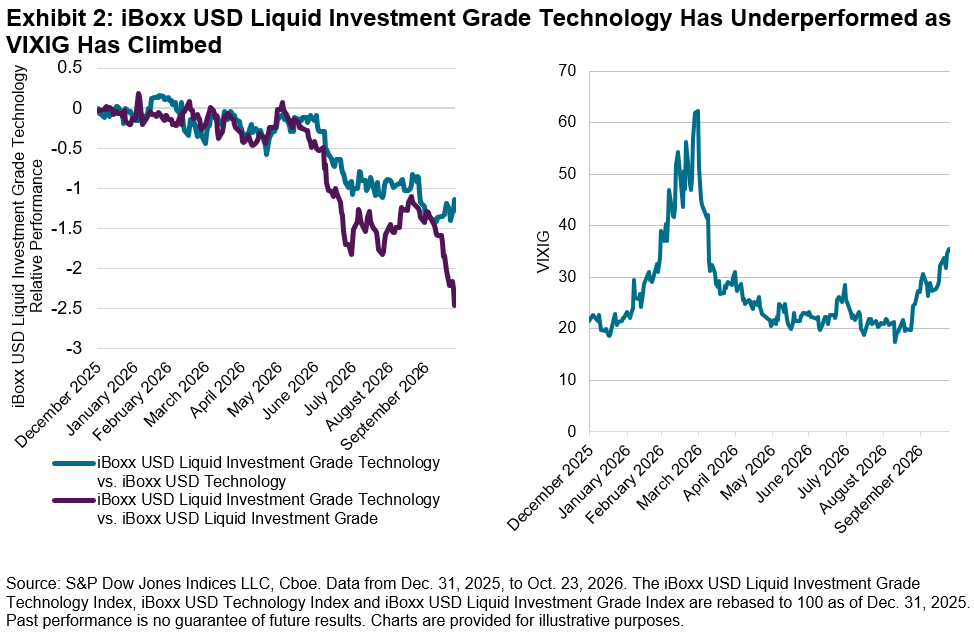
The impact of AI has also reverberated through the bond markets, as tech companies have increasingly relied on debt to finance their investments in AI. The iBoxx USD Liquid Investment Grade Technology Index has underperformed the broader iBoxx USD Technology Index and the iBoxx USD Liquid Investment Grade Index YTD. This is consistent with the liquid technology index’s greater weight toward large hyperscalers, whose credit spreads have widened amid heavy new issuance.2 AI debt worries are also reflected in the rise of VIXIG, which measures implied volatility for U.S. investment grade markets using options on the CDX North American Investment Grade Index.3

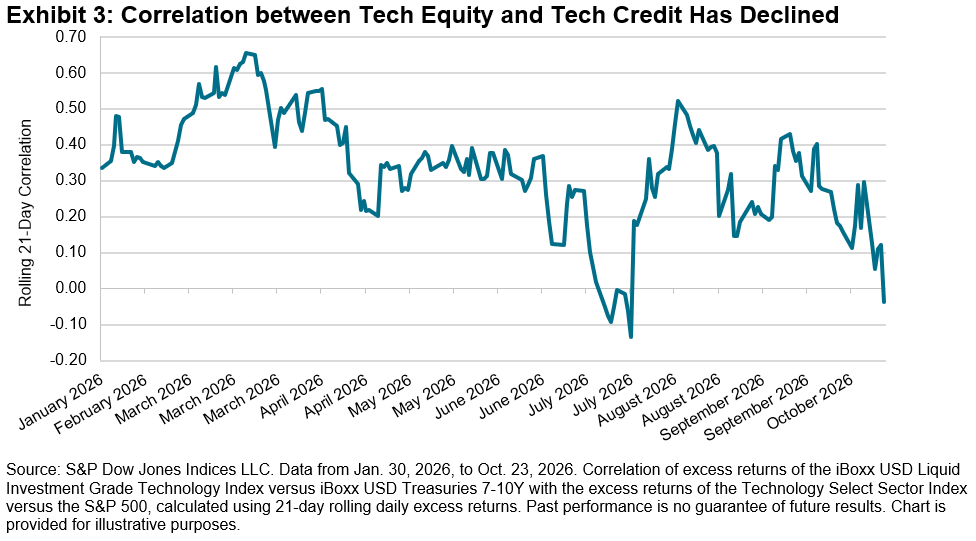
Combining the equity and debt perspectives, we observe in Exhibit 3 that the correlation between tech equity and tech credit excess returns has trended downward. While both have been under pressure, their day-to-day moves have increasingly diverged. The decoupling suggests the two asset classes are currently pricing the AI story differently. Equity investors may be weighing AI’s upside against its costs, while credit investors, whose returns are capped, focus more on the leverage required to fund it.

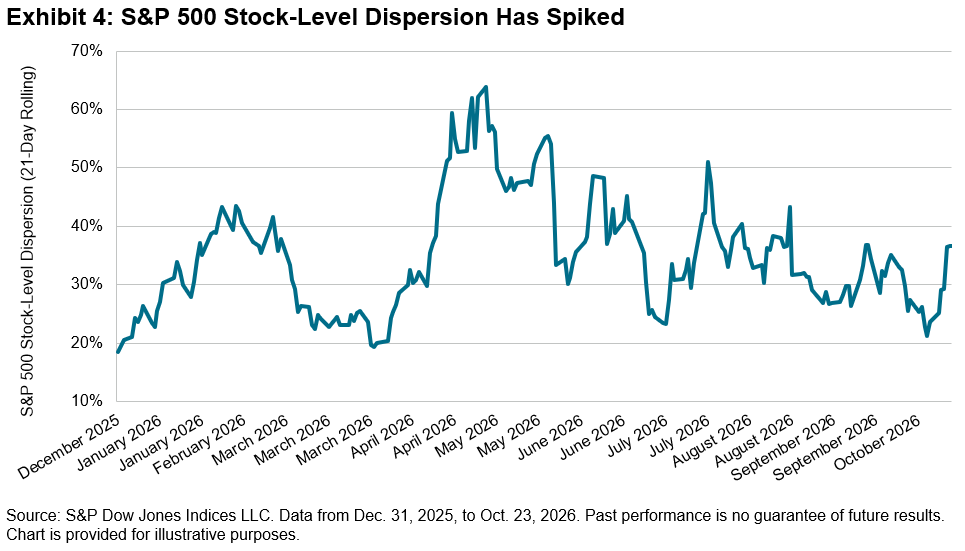
Returning to equities, do these market gyrations mean that it’s now a stock picker’s market?4 Dispersion, rather than correlations, can tell us about the value of stock-selection skill, which rises when dispersion is high. S&P 500 stock-level dispersion has risen sharply in recent weeks, as is typical during earnings season, with heavyweights Microsoft, Alphabet and Amazon reporting this week. But history tells us that it might be too early for active managers to rejoice.

The answer to our opening question may remain unknown, but understanding the impact of the AI trade across sectors and asset classes, as well as through the lens of volatility, may be useful in navigating today’s uncertain conditions.


1 As of Oct. 27, 2026.

2 Hodgson, Ramsay and Healy, Euan, “AI debt worries spark surge in default insurance trading”, The Financial Times, Oct. 20, 2026.

3 AI CDS spreads have widened as well. See US IG Credit: No sector is an island”, S&P Global Market Intelligence, Oct. 6, 2026.

4 Zuckerman, Gregory and Banerji, Gunjan, “Stock Pickers Burned by the AI Boom Think Their Moment Has Finally Arrived”, The Wall Street Journal, Oct. 19, 2026.

This content may be AI-assisted and is composed, reviewed, edited, and approved by S&P Global.

The posts on this blog are opinions, not advice. Please read our Disclaimers.
The Real Deal

Contributor Image
Joseph Nelesen

Head of Specialists, Index Investment Strategy

S&P Dow Jones Indices

For many Brazilian investors, accessing U.S. equities has traditionally involved a tradeoff. The S&P 500® tracks the performance of many of the world’s leading companies, including a vibrant technology sector driving much of the world’s AI innovation and capital expenditures. However, returns from Brazil’s local interest rates have competed with S&P 500 performance in BRL (S&P 500 (BRL)) and an international component can also introduce volatility from movements between the U.S. dollar and the Brazilian real. The S&P 500 Futures Quanto USD-BRL Currency Adjusted Index (S&P 500 Quanto) separates the Brazil and U.S. components by measuring U.S. equity futures performance while mitigating USD-BRL exchange-rate volatility.

The index measures the performance of the nearest-maturing quarterly E-mini S&P 500 futures contract trading on B3 and follows a quarterly roll schedule. It then applies quanto currency adjustment so that daily performance is settled in Brazilian currency rather than in the futures contract’s currency of denomination. The objective is not to add a directional currency bet, but to provide a cleaner measure of U.S. large-cap equity futures performance from a Brazilian perspective.

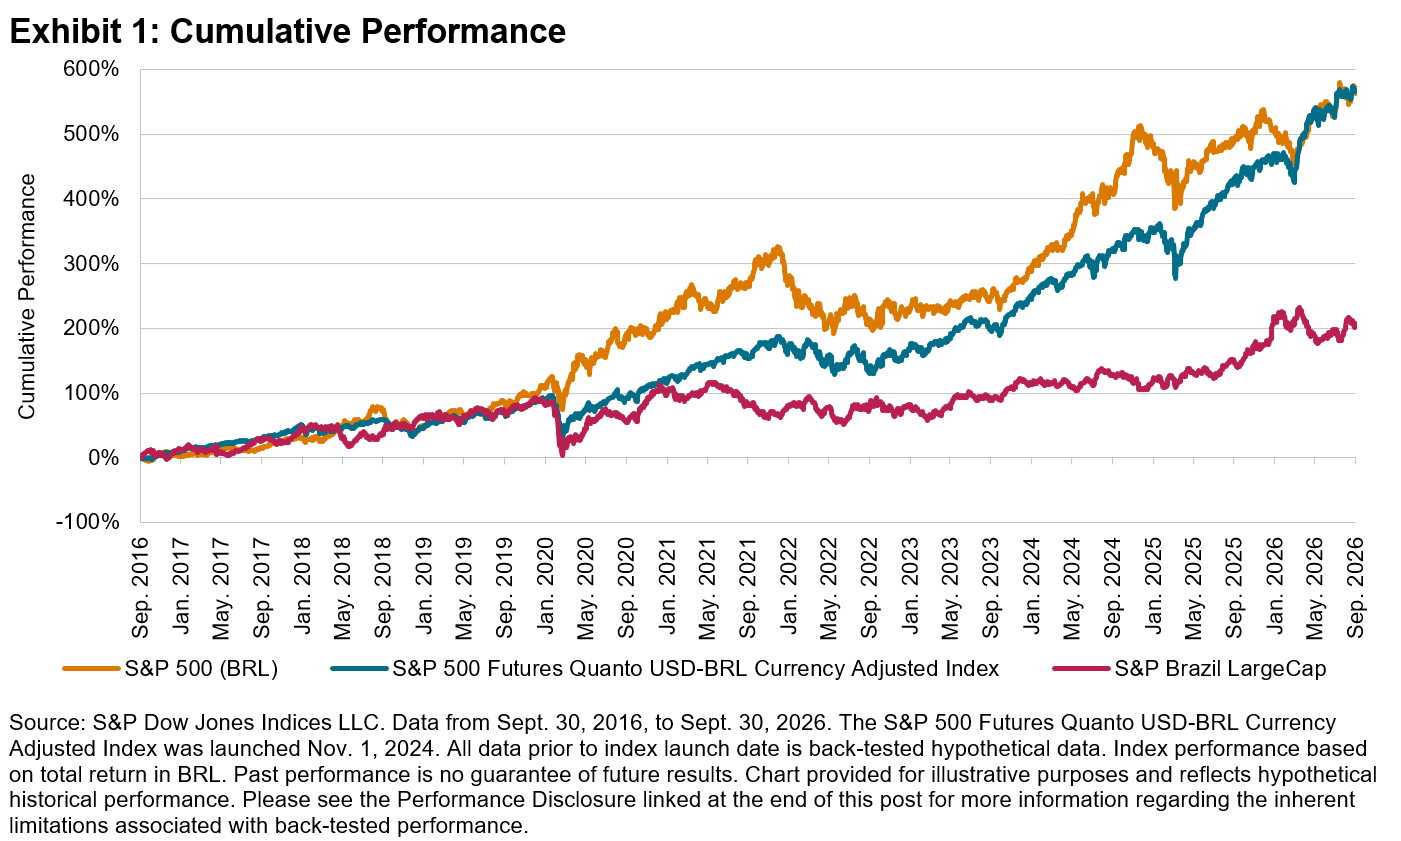
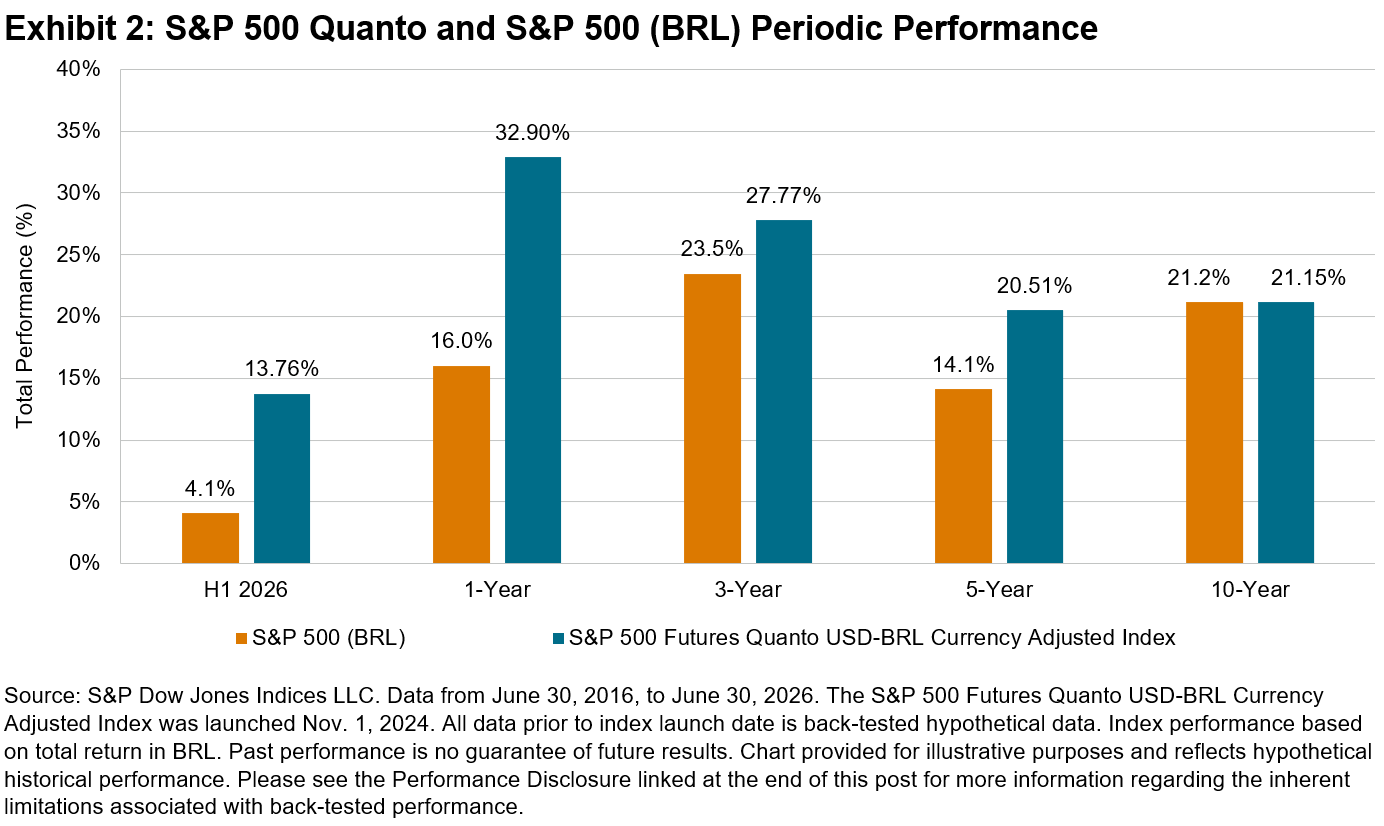
This currency-adjusted approach has produced a meaningful impact on relative performance. Exhibit 1, compares the cumulative performance of the S&P 500 Quanto, S&P 500 (BRL) and the S&P Brazil LargeCap over the past 10 years, illustrating the differential between U.S. and Brazilian equities as well as the impact of the quanto currency adjustment approach on The 500®.

Exhibit 2 illustrates the performance of the 500 Quanto and S&P 500 (BRL) over various periods through the end of Q3 2026.

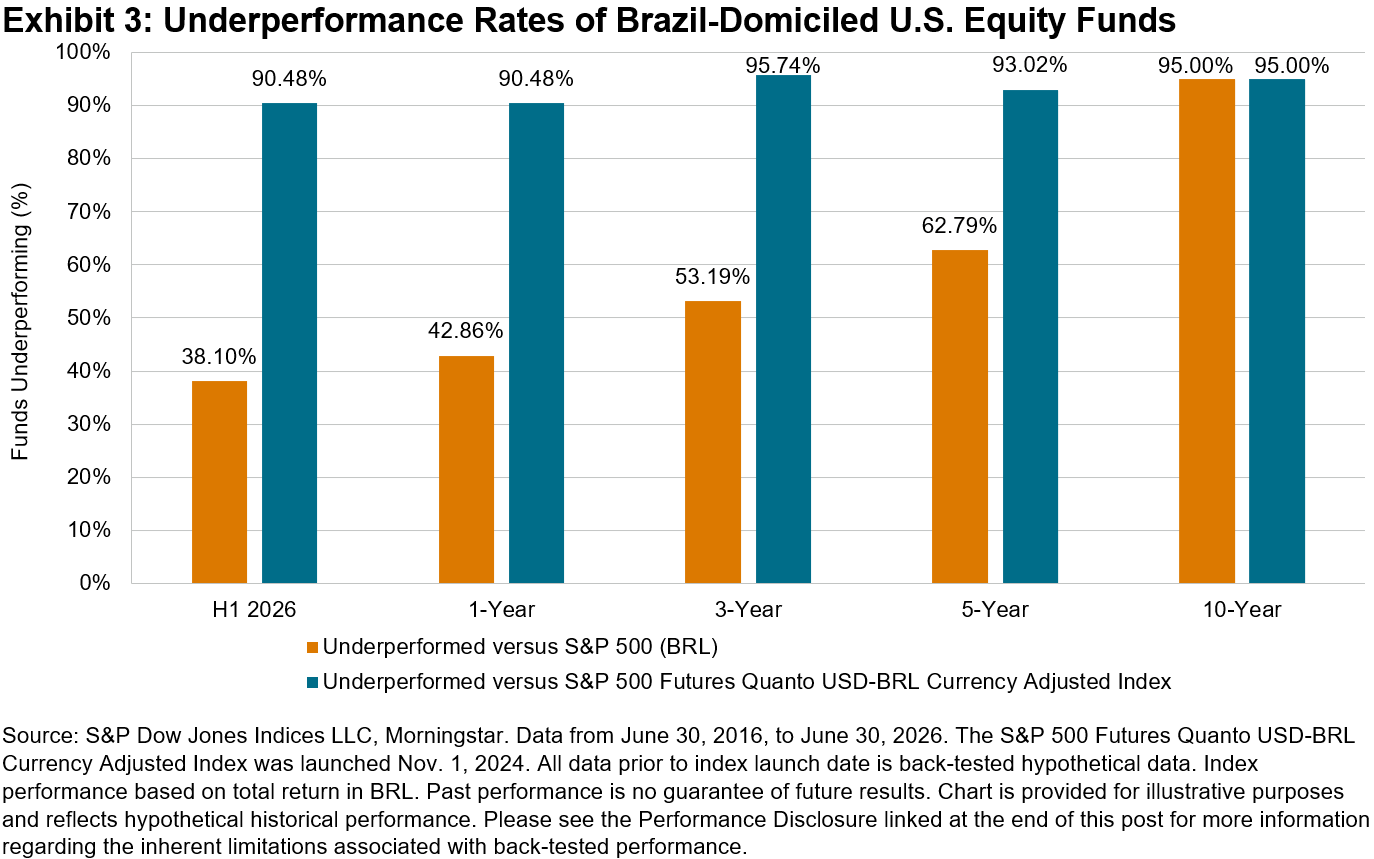
What does this benchmark comparison mean for Brazil? When evaluating the relative performance of active U.S. equity funds domiciled in Brazil, benchmark choices can lead to significant differences in outcomes. In S&P DJI’s SPIVA® Latin America Scorecards, we measure the performance of active U.S. equity funds against the S&P 500 (BRL). However, based on the performance differences mentioned previously, one would expect a greater proportion of active funds to underperform when measured against the S&P 500 Quanto. Exhibit 3 illustrates underperformance rates for Brazil-domiciled U.S. equity funds versus the S&P 500 (BRL) as reported in the SPIVA Latin America Mid-Year 2026 Scorecard, as well as how those same funds would have fared relative to the S&P 500 Quanto.

The results paint a very clear picture: although 38.1% of U.S. equity funds underperformed the S&P 500 (BRL) in the first half of 2026, 90.5% failed to beat the S&P 500 Quanto. Over longer back-tested horizons, the S&P 500 Quanto continued to outperform more than 90% of active U.S. equity funds, demonstrating how index innovation can address local market challenges with an eye to global diversification with the S&P 500.

This content may be AI-assisted and is composed, reviewed, edited, and approved by S&P Global.

The posts on this blog are opinions, not advice. Please read our Disclaimers.