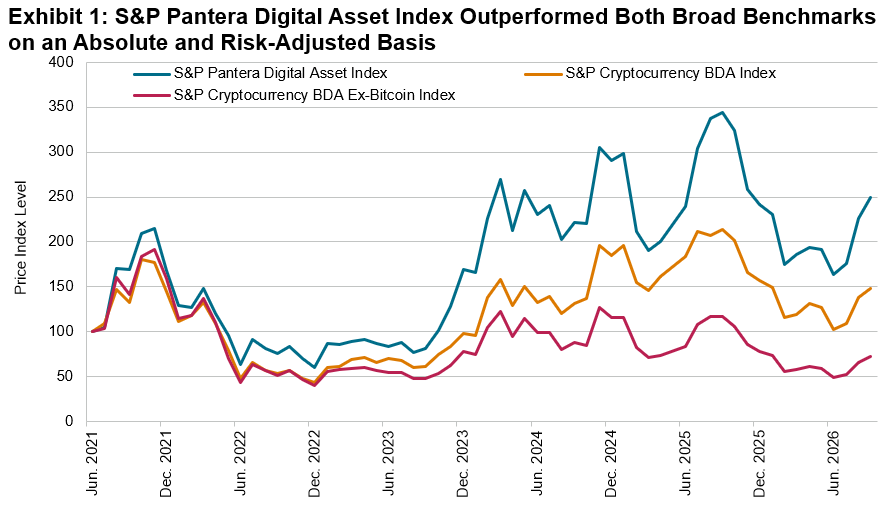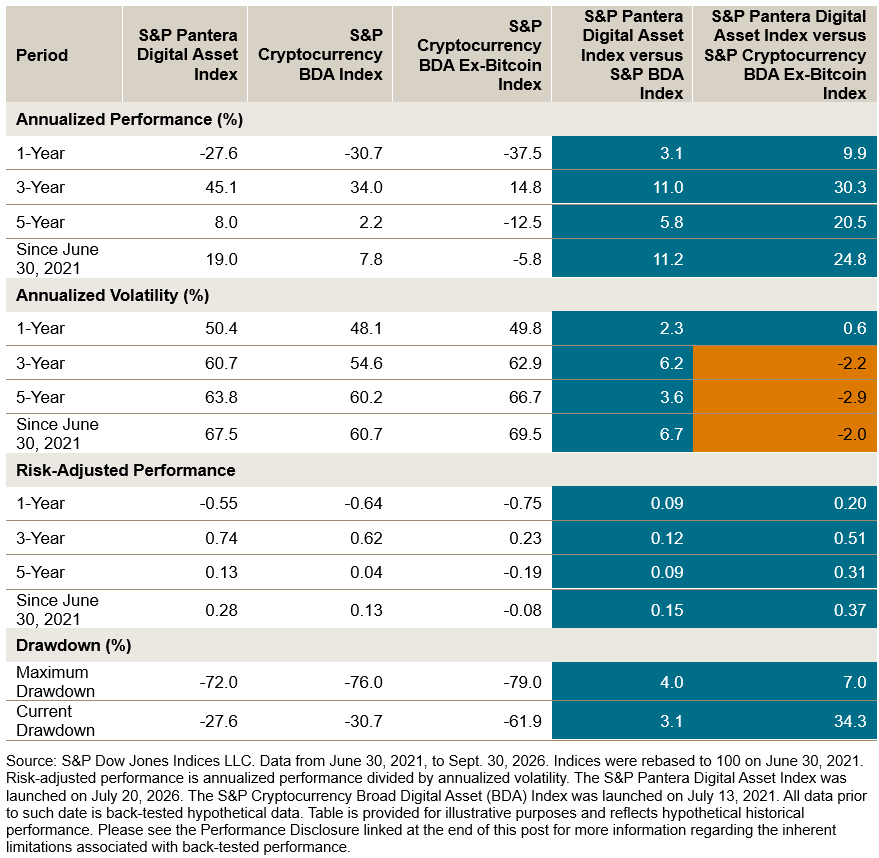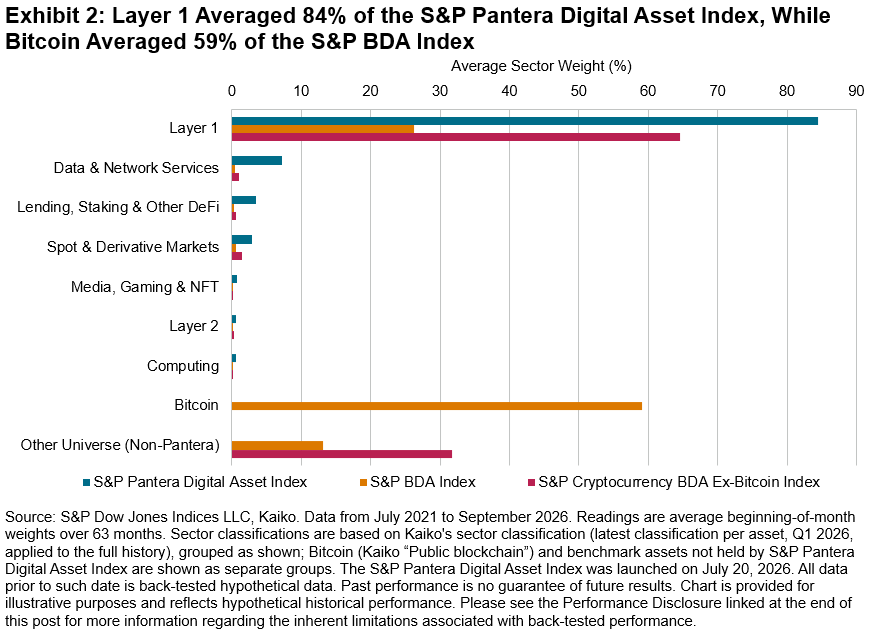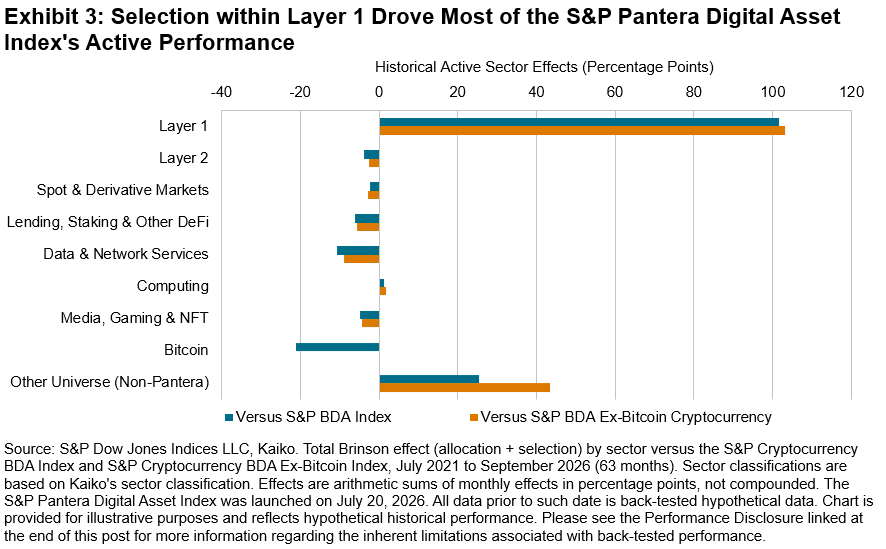







Sovereign bond yields have climbed to their highest levels in a decade across several major international markets, driven by elevated global energy prices and persistent inflation. As higher risk-free rates can weigh on equity valuations and raise the cost of capital, market participants may place greater emphasis on companies with strong profitability, higher-quality earnings and sound balance sheets.
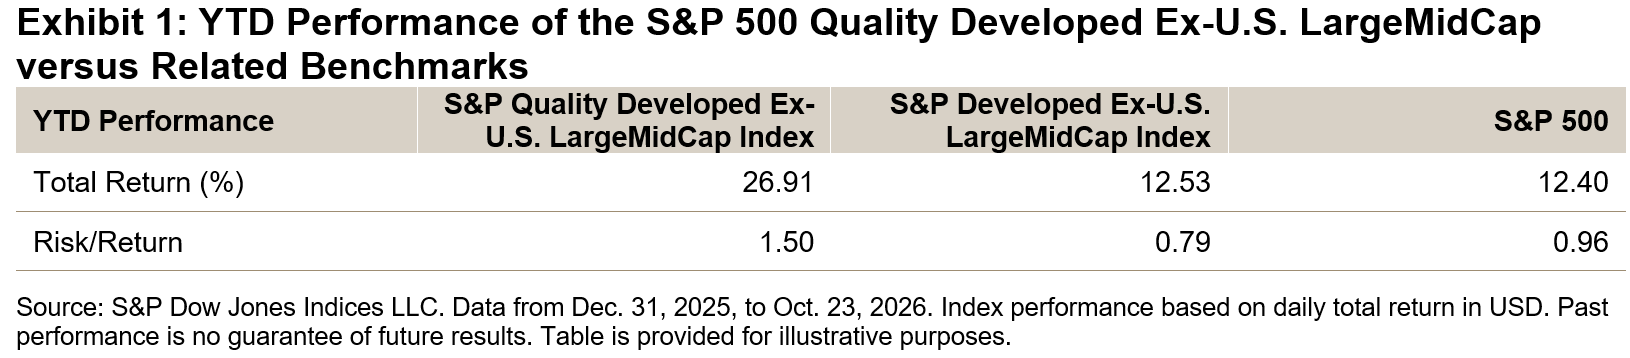
Against this backdrop, the S&P Quality Developed Ex-U.S. LargeMidCap Index has outperformed its benchmark YTD through Oct. 23, 2026.
Performance
As shown in Exhibit 1, the S&P Quality Developed Ex-U.S. LargeMidCap Index outperformed its underlying benchmark by about 14% YTD. This result is consistent with the index’s longer-term track record and highlights the historical performance characteristics of a quality-focused strategy. The index also outperformed the broad U.S. equity market, as represented by the S&P 500®.
Methodology Overview
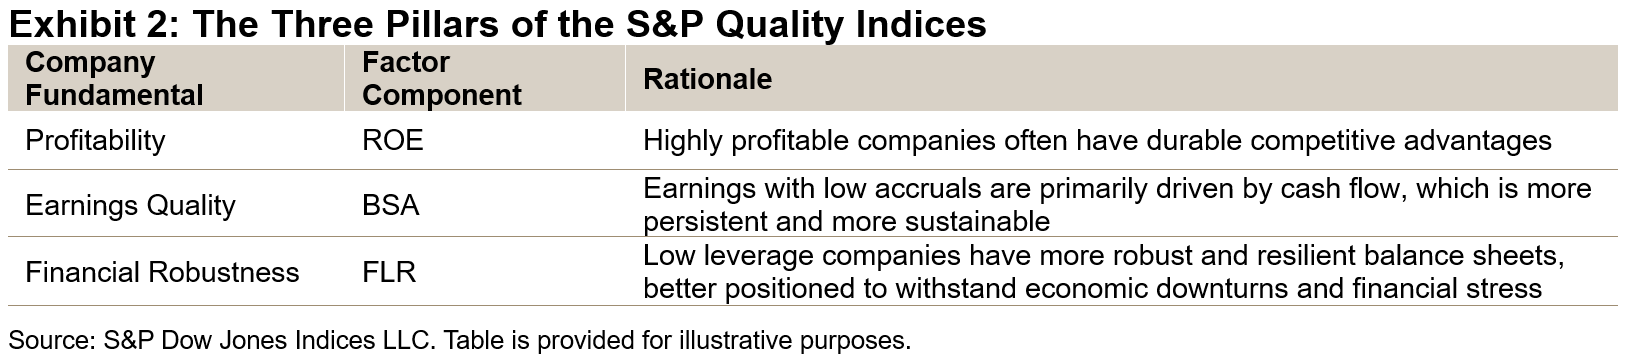
Higher quality companies may exhibit strong and stable profitability, sustained earnings growth, robust cash flows and prudent capital structures. The S&P Quality Indices assess these characteristics using three key metrics, shown in Exhibit 2: return on equity (ROE), the balance sheet accruals ratio (BSA) and the financial leverage ratio (FLR). Each metric offers a distinct perspective on a company’s overall quality.
The S&P Quality Developed Ex-U.S. LargeMidCap Index measures the performance of high-quality companies across developed markets outside the U.S. Its selection process identifies the top 20% of eligible stocks based on their quality scores. Constituents are then weighed by the product of their float market capitalization and quality scores, subject to constraints.1
Long-Term Outperformance
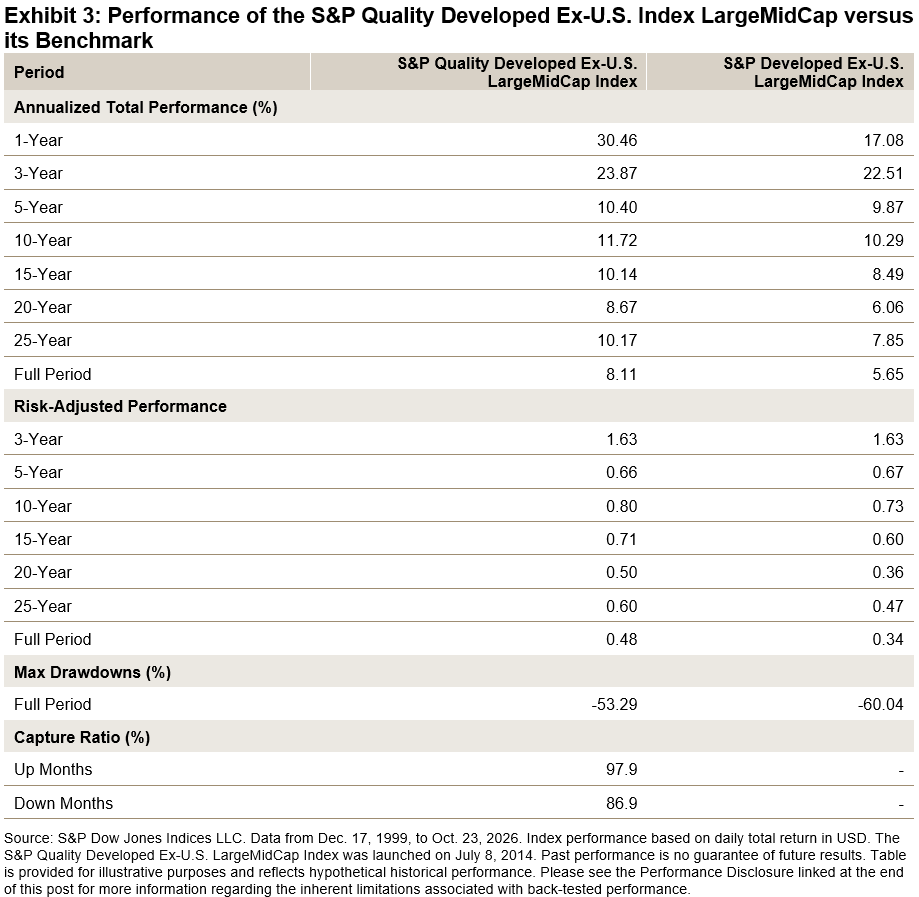
Across both short- and long-term horizons, the S&P Quality Developed Ex-U.S. LargeMidCap Index has outperformed its benchmark. The index has also historically exhibited defensive characteristics, including lower drawdowns and lower downside capture.
Performance across Economic Cycles
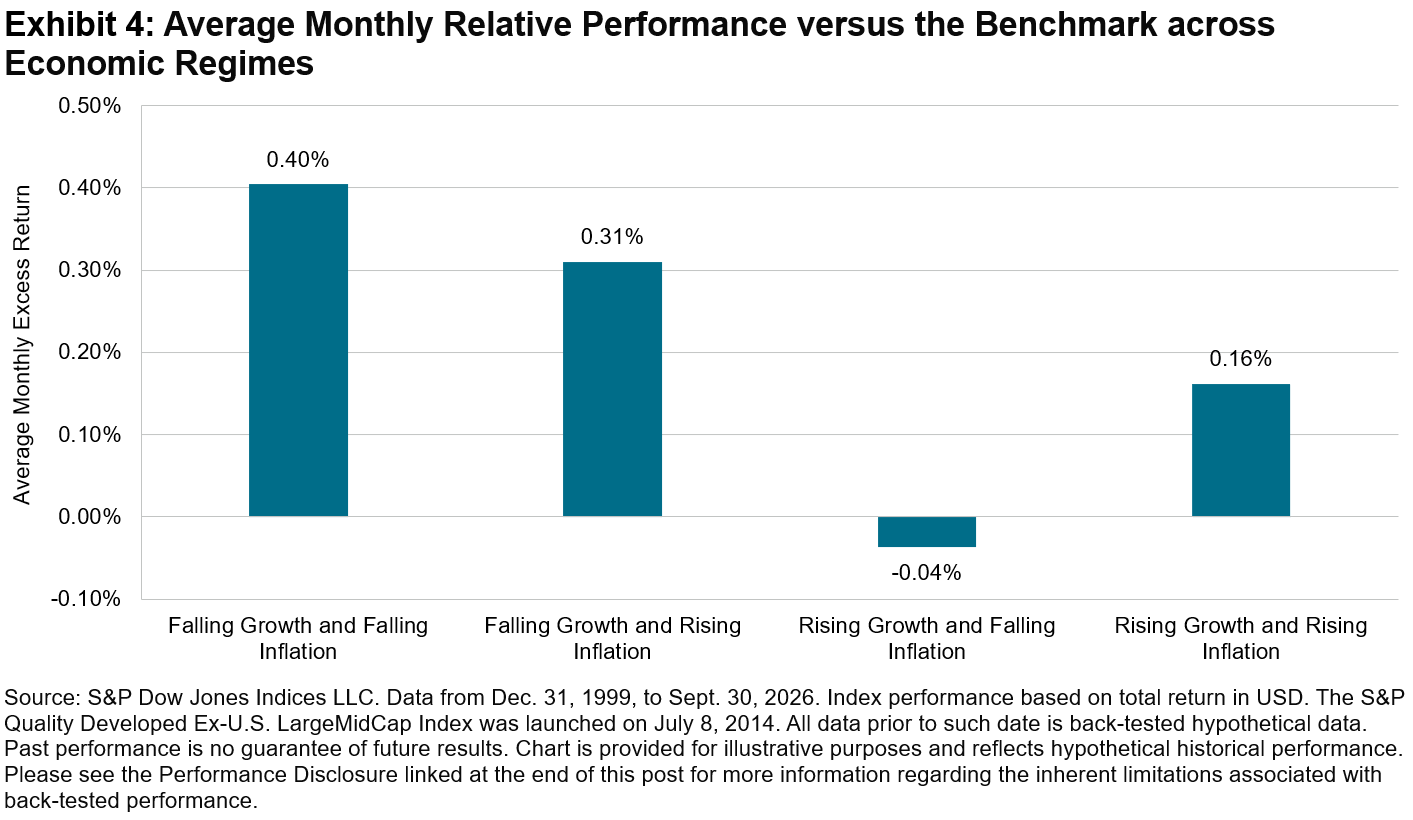
Exhibit 4 illustrates the index’s historical performance relative to its benchmark universe across four economic regimes, defined by rising or falling growth and inflation.2
Historically, the index has tended to outperform during periods of rising inflation, a regime that may be of particular relevance given the current market environment. This historical performance may reflect the structural resilience of companies with strong profitability, high earnings quality and robust balance sheets when inflationary pressures remain elevated.
A Large and Diverse Opportunity Set for Structural Diversification
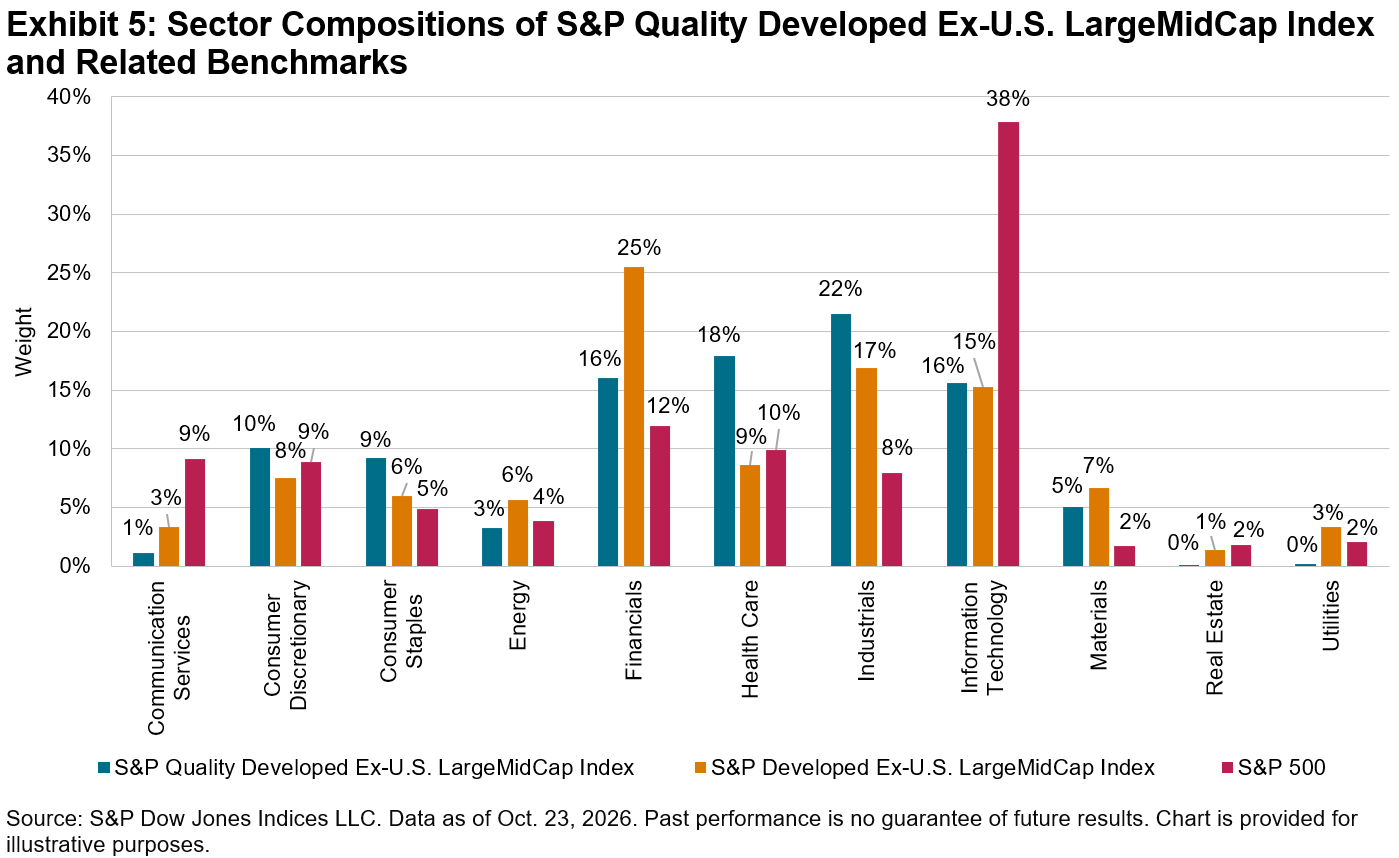
International equity markets reflect a broad range of geographies, economies and industries. The developed markets outside the U.S. represented in the S&P Quality Developed Ex-U.S. LargeMidCap Index have significant weight in Industrials, Health Care and Financials. This opportunity set differs meaningfully from the tech-heavy U.S. market.
Country Composition
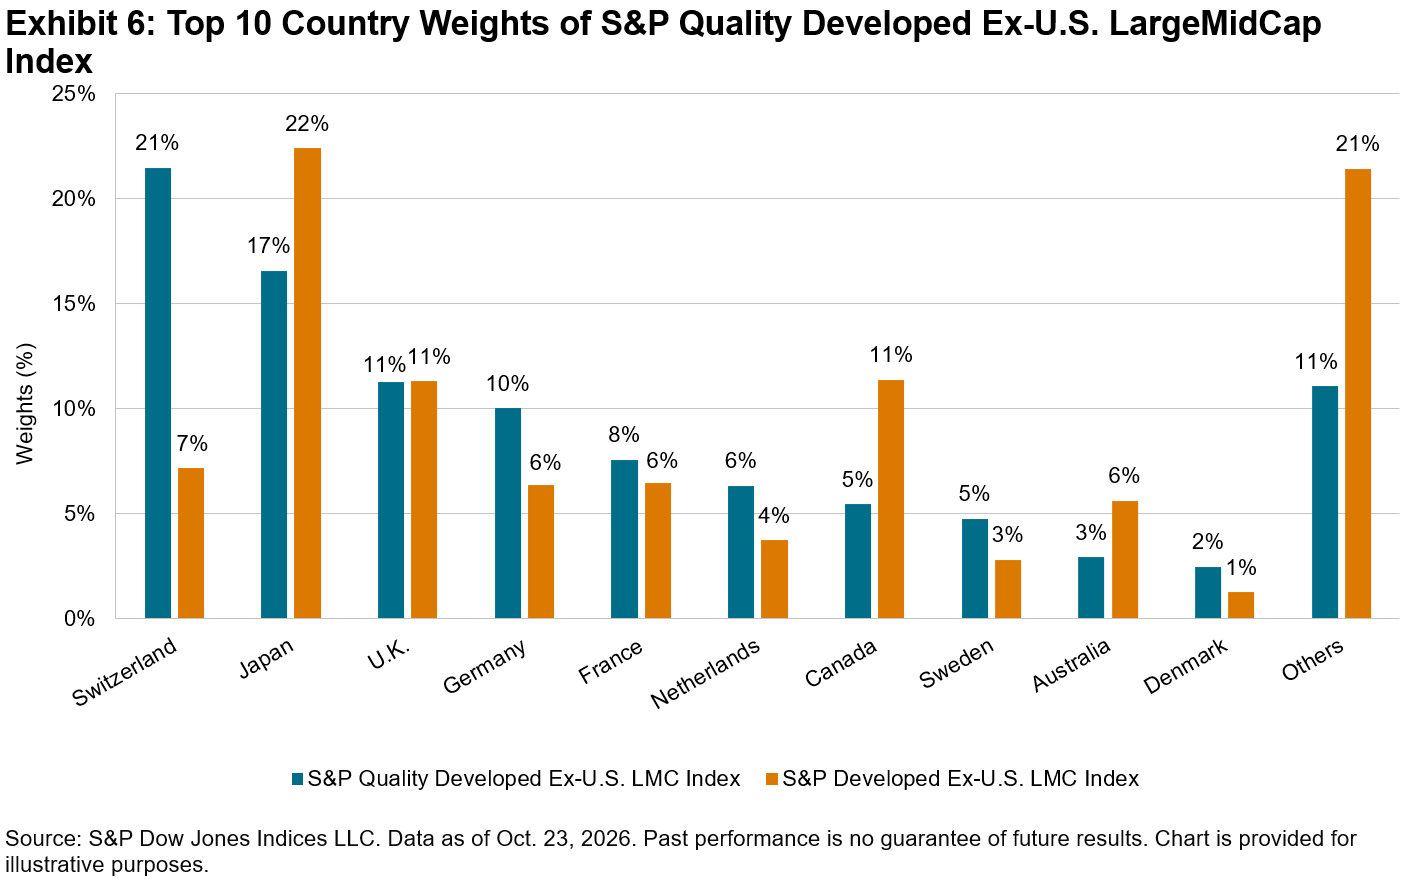
The S&P Quality Developed Ex-U.S. LargeMidCap Index has its largest absolute country weights in Switzerland, Japan, the U.K., Germany and France. Relative to its benchmark, the index is overweight in Switzerland, Germany and the Netherlands.
Conclusion
As global markets navigate elevated yields and persistent inflation, the S&P Quality Developed Ex-U.S. LargeMidCap Index may offer a lens for evaluating developed market equities outside the U.S. The index illustrates how companies with strong profitability, durable earnings and disciplined balance sheets have exhibited greater resilience across historic market cycles. This index offers a targeted lens for developed ex-U.S. equities and potential diversification characteristics worldwide.
1 For further information about the factor definition, factor score calculation and index design, please see the S&P Quality Indices Methodology.
2 Hao, Wenli Bill and Rupert Watts, “A Historical Perspective on Factor Index Performance across Macroeconomic Cycles,” S&P Dow Jones Indices LLC, August 2026.
The posts on this blog are opinions, not advice. Please read our Disclaimers.